


SEEFOR 17(1): 26014
Article ID: 26014
DOI: https://doi.org/10.15177/seefor.26-014
ORIGINAL SCIENTIFIC PAPER
Assessing Wildfire Susceptibility in Mediterranean Forest Ecosystems: A Spatial Ensemble Machine Learning Approach in Portugal
Mohamed Amine Laghmich1, *, Mohammed Ariche1, Bouthaina Ahayk1
Addresses: (1) Ibn Tofail University, Faculty of Humanities and Social Sciences, Department of Geography, Avenue de l’Université, B.P. 401, MA-14000 Kénitra, Morocco
Citation: Laghmich MA, Ariche M, Ahayk B, 2026. Assessing Wildfire Susceptibility in Mediterranean Forest Ecosystems: A Spatial Ensemble Machine Learning Approach in Portugal.South-east Eur for 17(1): 26014. https://doi.org/10.15177/seefor.26-014.
Received: 26 Jan 2026; Revised: 11 May 2026; Accepted: 27 Apr 2026; Published online: 26 Jun 2026
Cited by: Google Scholar
Abstract
Wildfires constitute a significant ecological disturbance in Mediterranean ecosystems, exerting profound effects on forest dynamics, biodiversity, and land management practices. The development of precise susceptibility mapping is essential for informing prevention strategies, optimizing resource allocation, and promoting sustainable forest management under increasing fire pressure. This study employed and compared four machine learning classifiers—Random Forest, Classification and Regression Trees (CART), Gradient Boosting, and Extreme Gradient Boosting (XGBoost)—to model wildfire susceptibility across Portugal. Six environmental and anthropogenic predictors were utilized: vegetation indices (NDVI), land use/land cover, slope, land surface temperature (LST), wind speed, and distance to human settlements. The results indicated that vegetation-related variables, particularly NDVI and land cover, were the most significant determinants of fire occurrence, followed by slope and wind speed, thus underscoring the role of biophysical conditions in shaping the fire regimes. A spatial block cross-validation strategy was implemented to rigorously account for spatial autocorrelation. Under this evaluation, XGBoost demonstrated the highest predictive performance (overall accuracy = 90.03%, AUC = 0.951), surpassing or equaling that of the other ensemble methods. The resulting susceptibility maps, generated utilizing simple Kriging interpolation to translate discrete model predictions into continuous surfaces, identified the northern and central interior regions as the most fire-prone, consistent with historical fire records. Quantitatively, the optimal model classified 19.08% of the national territory as having a very high fire susceptibility. Our findings underscore the efficacy of ensemble machine learning techniques in capturing complex fire–environment interactions and provide spatially explicit information that can enhance fire prevention planning, support conservation priorities, and guide adaptive forest management in Mediterranean regions.
Keywords: wildfire susceptibility; forest fire risk assessment; Mediterranean forest ecosystems; forest management; spatial block cross-validation; biophysical drivers; fire ecology
INTRODUCTION
Portugal, distinguished by its Mediterranean climate and dynamic land use and land cover (LULC) changes, has witnessed evolving wildfire trends that present significant environmental and socio-economic challenges (Parente et al. 2018, Oliveira and Zêzere 2020). The Mediterranean region is particularly susceptible to wildfires because of its hot, dry summers, frequent droughts, and vegetation that is prone to ignition. In recent years, extreme heatwaves with temperatures surpassing 48°C have precipitated devastating wildfires across Mediterranean countries, resulting in loss of life, extensive property damage, and environmental degradation (Turco et al. 2019).
For instance, in Portugal, over 7,032 rural fires consumed 25,429.5 hectares of land from January to August 2025, which was more than three times the area burned during the same period in 2024 (ICNF 2025).
The accumulation of dry vegetation and human activities in proximity to forested areas increases the risk of uncontrollable mega-fires that often exceed firefighting capacities. In terms of specific causes, the overwhelming majority of wildfire ignitions in Portugal are anthropogenic. These are primarily driven by the negligent use of fire in agricultural and forestry practices (such as traditional brush burning), accidental ignitions from machinery, and intentional acts, whereas natural causes, such as lightning strikes, account for a small minority of events. In Portugal, climate change coupled with trends in rural land abandonment and land-use changes has led to increased fuel loads and wildfire incidents within vulnerable forest ecosystems (Eurostat 2025, Thies 2025).
These fires pose threats to lives, ecosystems, and economic assets, and significantly contribute to carbon emissions. For instance, wildfires across the European Union in 2025, in the period up to late August, released an estimated 38.37 million tonnes of CO₂, reaching a record for that time period (European Commission 2025).
Despite the recognized dangers, wildfire management in the Mediterranean region typically emphasizes full suppression, which can paradoxically elevate the risk of larger and more intense fires by permitting fuel accumulation (Fernandes and Botelho 2003). To move toward proactive management, recent advancements have increasingly utilized machine learning to assess regional fire risk. For example, Thies (2025) applied machine learning to map wildfire susceptibility across Germany, while Durlević et al. (2025) demonstrated the efficacy of multi-sensor satellite data fusion for predicting fires in Serbia. Similarly, Sapkota et al. (2025) utilized comparable algorithms to advance wildfire prediction in Nepal. Within the Mediterranean context, foundational studies such as Tonini et al. (2020) have mapped wildfire susceptibility using machine learning techniques. Despite these advancements in wildfire susceptibility modelling, critical gaps related to spatial bias and overly optimistic model validation persist, potentially limiting its accuracy and practical applicability (Parente et al. 2018, Jaafari and Pourghasemi 2019).
Specifically, many existing regional assessments overlook the impact of spatial autocorrelation, leading to inflated accuracy. Addressing these issues is crucial; therefore, this study represents a substantial methodological improvement that was achieved by implementing a rigorous spatial block cross-validation strategy to ensure the ecological validity of the predictions.
This study addresses these gaps by pursuing two primary objectives: first, to systematically compare the performance of four ensemble machine learning models—Random Forest, CART, Gradient Boosting, and XGBoost—for wildfire susceptibility mapping in Portugal under strict spatial validation; and second, to identify and evaluate the most influential environmental and anthropogenic predictors driving fire occurrence in these forest ecosystems. These findings provide a robust framework for wildfire risk assessment, offering spatially explicit insights to inform forest management and policy decisions.
By integrating the understanding of wildfire dangers specific to Mediterranean environments and addressing modelling limitations, this study aims to contribute to more accurate, reliable, and spatially explicit wildfire risk assessment in Portugal. This will aid in adopting proactive fire management strategies that balance suppression and ecosystem resilience, thereby helping to mitigate the impacts of wildfires in a changing climate.
MATERIALS AND METHODS
Study Area
Portugal, situated at approximately 39.4° N, 8.22° W on the Iberian Peninsula, has a total area of 92,212 km² and a population of approximately 10.2 million (Central Intelligence Agency 2025). The country is characterized by a Mediterranean climate with hot, dry summers and mild and wet winters (Parente et al. 2018, Oliveira and Zêzere 2020). Combined with the varied topography and extensive forest cover, this climate makes Portugal highly susceptible to wildfires during the summer months.
The landscape is a mosaic of forests, shrublands, agricultural land, and settlements. Forests cover approximately 36% of the territory (Eurostat 2025), with fire-prone regions concentrated in the northern and central inland districts, such as Vila Real, Braga, Aveiro, and Coimbra. Mountainous terrain with steep slopes and dense vegetation further increases the wildfire risk due to fuel accumulation and enhanced fire spread potential.
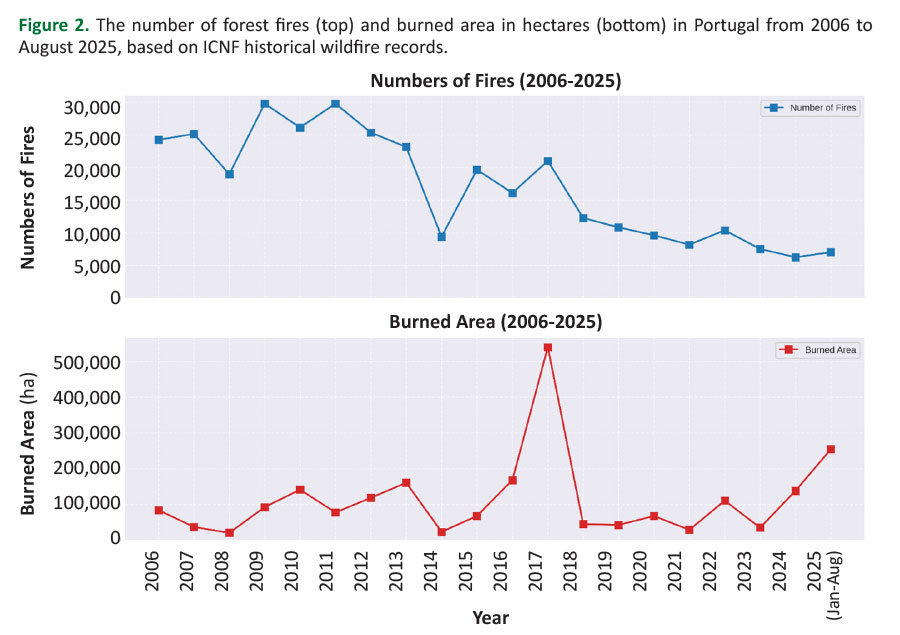
Wildfires have intensified in recent years. In the first seven months of 2025, over 7,032 rural fires were recorded, burning approximately 254,295 hectares across the country (Figure 2) (ICNF 2025). These events affected regions nationwide, causing widespread damage and evacuations.
 Figure 1. Study area location.
Land use and land cover (LULC) changes also play critical roles. Rural depopulation and land abandonment contribute to higher fuel loads, whereas flammable eucalyptus and maritime pine plantations exacerbate fire intensity under drought conditions aggravated by climate change.
This combination of environmental, climatic, and human pressures makes Portugal a challenging study area for wildfire prediction. Understanding the spatial and temporal fire susceptibility patterns of this species is essential for advancing prevention strategies and risk mitigation.
Historical Forest Fires
Historical forest fire data for this study were sourced from the Institute for Nature Conservation and Forests (ICNF) of Portugal, the principal national authority responsible for forest and wildfire monitoring. The ICNF database contains detailed records of fire incidents, including annual fire counts and total burned areas, offering a comprehensive overview of wildfire trends in Portugal from 2006 to 2025 (ICNF 2025).
As illustrated in Figure 2, from 2006 to 2013, annual fire counts exceeded 25,000 events, peaking at nearly 30,000 fires around 2013. Since 2020, fewer than 10,000 fires annually have been reported, indicating a significant decline in fire frequency.
The patterns of burned areas exhibit greater interannual variability (Figure 2). Most years between 2006 and 2024 experienced burned areas ranging from 50,000 to 200,000 hectares. However, 2017 is notable as an extreme fire season with over 500,000 hectares burned (Turco et al. 2019). Following this peak, annual burned areas generally remained lower, although recent increases in 2024 and 2025 suggest a potential resurgence of large-scale fire activity. In 2025 (January to August), the burned area exceeded 254,000 hectares.
These data reflect the evolving fire regime in Portugal and underscore the importance of the long-term monitoring capabilities maintained by ICNF. The detailed ICNF records serve as both a historical context and a crucial validation reference for this study’s analysis and modelling of wildfire susceptibility (Almeida et al. 2024).
Overall, the historical analysis demonstrates that while the number of fires has decreased over time, the magnitude of burned areas remains highly variable, reflecting the strong influence of climatic extremes, vegetation conditions, and human factors. These findings highlight the need for robust susceptibility modelling and spatial planning to mitigate the risks of severe fire events in the region.
Data Collection and Sample Generation
Wildfire susceptibility modelling in this study was based on a binary dependent variable: fire presence or absence. Fire presence data were obtained from the MODIS Active Fire product (MCD14ML, FIRMS) for the period 2015–2024 (Giglio et al. 2016). The dataset was subjected to a cleaning process to ensure its ecological relevance and accuracy. Specifically, fire detections located within built-up areas were removed to restrict the analysis to forest and shrubland fires, and spurious detections, such as single isolated pixels and cloud-related anomalies, were also excluded.
Although the initial database contained over 200,000 recorded fire pixels, utilizing the entire dataset in machine learning classifiers introduces severe spatial autocorrelation and data redundancy. Because large wildfire events span thousands of adjacent pixels with nearly identical environmental characteristics, using all available points leads to severe model overfitting, in which the algorithm memorizes specific fire shapes rather than learning the underlying biophysical drivers. To mitigate this and ensure statistical independence, a spatial thinning approach was used.
From this cleaned dataset, 1,000 spatially independent fire points were randomly selected as positive samples. To create a balanced dataset, an equal number of no-fire points (1,000) were randomly generated in areas that showed no active fire detection during the same period (Tonini et al. 2020). Maintaining a strict 1:1 ratio of presence to absence points is critical for tree-based ensemble models, which are highly sensitive to class imbalance and may otherwise develop a predictive bias toward the majority class.
A minimum buffer distance was applied to ensure no spatial overlap with fire pixels and to further reduce the spatial dependency between samples. A final balanced dataset of 2,000 samples was used for model training and validation, providing a robust, computationally efficient, and ecologically representative foundation for spatial algorithms.
Explanatory Variables
Six explanatory variables were downloaded and processed using Google Earth Engine (GEE), which provides convenient access to extensive satellite imagery and geospatial datasets with planetary-scale computational capabilities. Although wildfire occurrence is influenced by a vast array of factors, these six specific predictors were deliberately selected based on established Mediterranean fire ecology principles (Jaafari and Pourghasemi 2019, Oliveira and Zêzere 2020). They represent the core biophysical and anthropogenic drivers of fire regimes: fuel availability and continuity (NDVI, LULC), topographic spread capability (slope), chronic climatic preconditioning (LST, wind speed), and human ignition pressure (distance to settlements). Although high-temporal-resolution meteorological data (e.g., daily humidity or precipitation) are highly effective for short-term active fire forecasting, the chosen long-term averaged and static variables are the most appropriate predictors for mapping chronic, long-term baseline wildfire susceptibility at the national scale.
The use of GEE allowed for the efficient extraction of variable values at 2,000 sample points directly at their native spatial resolutions, facilitating consistent and reproducible data preparation for model training with minimal need for broad resampling procedures.
- Vegetation: NDVI (2015–2024 average) derived from Landsat 8 and 9 surface reflectance images (Vermote et al. 2016).
- Topography: Slope derived from the 30 m SRTM DEM (Farr et al. 2007).
- Human Pressure: Distance to settlements calculated from the GHSL Built-Up product (2024) using a Euclidean distance transform (European Commission Joint Research Centre 2024, Verde and Zêzere 2010).
- Land Cover: LULC extracted from the Dynamic World product (Sentinel-2, 10 m) for 2024 (Brown et al. 2022).
- Climate: Land surface temperature (LST) from MODIS Terra (MOD11A2.061) and Aqua (MYD11A2.061), averaged for 2015–2024 (1 km) (Wan et al. 2021). Wind speed was extracted from the ERA5-Land reanalysis; although its native spatial resolution is 10 km, it was resampled to 1 km using bilinear interpolation to ensure perfect spatial alignment with the other environmental (Muñoz-Sabater et al. 2021).
Methodology Workflow
The methodology of this study followed a structured workflow for predicting wildfire susceptibility, as illustrated in Figure 3. The process began with data preparation and continued with machine learning model development, validation, and final generation of the susceptibility maps.

Data Preparation
The final dataset for modelling consisted of 2,000 balanced samples (1,000 fire and 1,000 no-fire) derived from the methods described in Section 2.3. The explanatory variables included vegetation (NDVI), topography (slope), land surface temperature (LST), wind speed, land cover (LULC), and distance to settlements (Section 2.4). Using a point-based sampling approach, values for each of these variables were extracted directly from their native-resolution raster layers at the 2,000 sample locations, ensuring that multi-resolution datasets could be consistently integrated into a single feature table for model training (Tang et al. 2022).
Following the machine learning predictions at these sample locations, the discrete probability outputs were interpolated into a continuous spatial surface using the kriging method. Kriging was specifically selected because it is a robust geostatistical technique that accounts for spatial autocorrelation, providing statistically optimal predictions across unsampled areas (Diggle et al. 2003). This process yielded a final national wildfire susceptibility map with a uniform spatial resolution of 1 km, effectively harmonizing the varied resolutions of the initial predictor variables.
Before model training, the dataset was pre-processed. Categorical and continuous predictors were standardized into a compatible format, and anomalous records were removed to improve the data quality. To address the issue of multicollinearity among the explanatory variables, the Variance Inflation Factor (VIF) and tolerance methods were applied (Ahmed et al. 2024). All six variables were found to have VIF values below the conventional threshold of 10, indicating no significant multicollinearity issues and confirming their suitability for inclusion in the model (El Mazi et al. 2024).
Machine Learning Models
Four distinct machine learning algorithms were employed to model wildfire susceptibility: Random Forest (RF), Classification and Regression Tree (CART), Gradient Boosting (GB), and Extreme Gradient Boosting (XGBoost). These specific tree-based and ensemble algorithms were selected over traditional parametric models because wildfire ignition and spread are governed by highly complex nonlinear interactions between climate, topography, and human activity. Tree-based models are highly robust to outliers, do not require assumptions of data normality, and effectively manage the multidimensionality of spatial environmental datasets (Hastie et al. 2009). These models were selected because of their proven performance in spatial predictions and their ability to capture both linear and nonlinear relationships among predictors.
- Random Forest (RF): An ensemble learning method that builds a forest of K=200 decision trees h(x, Өk), where Өk represents randomness in the tree-building process. The final classification is made by aggregating all tree votes via majority voting to improve prediction stability and reduce overfitting:
ƒ^(x) = mode{h(x, Өk), k=1, ...200} (1)
The choice of 200 trees balances model accuracy with computational efficiency (Breiman 2001). - Classification and Regression Tree (CART): CART recursively partitions the feature space into distinct regions by selecting splits that maximize the reduction in impurity, which is typically measured by the Gini index for classification:
Gini(t) = 1-Σji=1 pi2 (2)
where pi is the proportion of class i observations in node t. The result is a tree of decision rules that creates homogeneous groups with respect to wildfire occurrence (Breiman et al. 2017). - Gradient Boosting (GB): GB builds an additive model in a forward stage-wise manner by minimizing a differentiable loss function L(y, F(x)) using weak learners hm(x) added sequentially:
Fm(x) = Fm-1(x) + v · hm(x) (3)
where v is the learning rate, and each hm is trained on the residuals of the previous model Fm-1 (Friedman 2001). - Extreme Gradient Boosting (XGBoost): An optimized version of GB that includes regularization terms to control the model complexity. The objective function includes the loss function and a regularization term Ω(ƒ):
Obj = Σj L(yi, y^) + Σk Ω(ƒk) (4)
where ƒk are the decision trees, and - Ω(ƒk) ϒT + λ ||w||2 with T as the number of leaves and w the leaf weight (Chen and Guestrin 2016).
Each model was trained on the training subset with hyperparameters optimized through a grid search, maximizing performance metrics such as accuracy, Area Under the Receiver Operating Characteristic Curve (AUC-ROC), and F1-score. Rather than utilizing a standard random hold-out validation set, which is susceptible to spatial data leakage, the grid search was executed using a nested cross-validation approach strictly within the 78-fold Spatial Block Cross-Validation framework.
Specifically, during each iteration, the hyperparameters were tuned exclusively on the data within the training blocks, ensuring the spatial test block remained completely unseen. The final optimized hyperparameters for each model are listed in Table 2. To ensure the robustness of the models and mitigate overfitting caused by spatial autocorrelation, a strict 78-fold Spatial Block Cross-Validation strategy was employed. Unlike traditional random k-fold cross-validation, which can leak spatially proximate training data into the validation set, this spatial blocking approach forces the models to predict wildfire occurrences in entirely unseen geographic regions, thereby guaranteeing the ecological and spatial validity of the final prediction.
These models complement each other by balancing bias-variance trade-offs and exploiting different strengths in handling variable interactions, missing data, and noise, making them suitable choices for spatial wildfire susceptibility prediction.
Model Validation and Feature Importance
All analyses were performed in Python within the Google Collab environment, using scikit-learn for machine learning and model evaluation, and stats models for multicollinearity diagnostics (Seabold and Perktold 2010, Tonini et al. 2020). A multi-step validation strategy was adopted to ensure the reliability of the wildfire susceptibility models. First, the explanatory variables were examined for multicollinearity using the Variance Inflation Factor (VIF) and tolerance statistics (O’Brien 2007).
The VIF for the ith predictor is defined as:
 (5)
(5)
where R2i is the coefficient of determination of the regression of the ith predictor against all other predictors. All six predictors (NDVI, slope, LST, wind speed, LULC, and distance to settlements) showed VIF values well below the threshold of 10, confirming the absence of significant multicollinearity and ensuring their suitability for the model.
To explicitly address spatial autocorrelation and provide rigorous algorithmic validation, a 78-fold Spatial Block Cross-Validation procedure was implemented. Unlike traditional random sampling, spatial blocking ensures that the training and validation points are geographically separated, forcing the model to predict entirely unseen spatial regions. Each model was evaluated using five key metrics (Area Under the Curve (AUC), accuracy, precision, recall, and F1-score) to comprehensively assess the overall correctness, the ability to detect fire occurrences, sensitivity to actual fires, and balance between precision and recall (Sokolova and Lapalme 2009). The performances were averaged across 78 spatial blocks to yield robust estimates, thereby mitigating spatial overfitting.
Instead of a traditional independent hold-out split (e.g., a random 80/20 split), which is prone to spatial data leakage, this spatial blocking effectively functions as a rigorous leave-one-block-out (LOBO) evaluation. By iteratively hiding an entire geographic region during training and evaluating solely on that unseen block, this method definitively confirms the predictive power of the models and their ability to generalize to new, unmapped territories.
To evaluate the influence of the predictors, permutation importance was utilized (Altmann et al. 2010). Unlike built-in impurity-based metrics that can be biased toward continuous variables, this model-agnostic technique quantifies feature importance by randomly shuffling the values of a single predictor and measuring the resulting decrease in the model performance score (e.g., AUC). A larger drop indicates that the model relies heavily on that feature. This robust technique allowed us to accurately quantify the relative contribution of each environmental and anthropogenic predictor to the wildfire susceptibility.
Finally, to validate the geostatistical interpolation of the model outputs, a cross-validation of the simple kriging method was performed in ArcGIS Pro (Esri 2025). Measured values were compared with predicted values at withheld locations, and error statistics such as the Root Mean Square Error (RMSE) and Mean Error (ME) were calculated (Cressie 1993).
These metrics are defined as follows:
 (6)
(6)
 (7)
(7)
where Z(si) and Ẑ(si) are the observed and predicted values at location si, Z and Ẑ are their respective means, and n is the number of validation points.
This additional step ensured that the interpolated susceptibility surface preserved the spatial structure of the predictions, while maintaining acceptable accuracy.
This combined validation framework, including multicollinearity analysis, spatial block cross-validation, and permutation importance diagnostics, ensured both the statistical robustness and ecological interpretability of the wildfire susceptibility models.
Susceptibility Mapping
The final wildfire susceptibility map was generated by applying the best-performing machine learning model to the predictor variables across the entire study area, producing continuous wildfire probability values between 0 and 1. To account for spatial dependencies, these outputs were interpolated using the geostatistical method of simple kriging (O’Sullivan and Unwin 2010).
While kriging is conventionally applied to continuous physical variables, its application to machine learning probability outputs was deliberately chosen for this study. It effectively smooths discrete, pixel-based probabilities into a continuous regional susceptibility surface, mitigating localized noise.
This geostatistical smoothing accounts for the inherent spatial autocorrelation of fire spread, providing decision-makers with generalized regional “hot-spots” that are more practical for landscape-scale management than fragmented pixel predictions. This method incorporates spatial autocorrelation to produce a smooth and realistic susceptibility surface compared to deterministic approaches such as Inverse Distance Weighting (IDW).
Simple kriging estimates the value at an unsampled location s0 as a weighted sum of the observed values:
Ẑ(s0) = Σni=1 λiZ(si) (8)
where Z(si) are the known values at locations si, and weights λi are calculated based on the spatial covariance structure between the points to minimize estimation variance and ensure unbiasedness (Cressie 1993).
The interpolated susceptibility surface was reclassified into five risk levels: very low (0.00–0.20), low (0.2–0.40), medium (0.40–0.60), high (0.60–0.80), and very high (0.80–1.00) (Thies 2025). These thresholds were defined based on exploratory data analysis and expert consultation to support meaningful interpretation for fire risk management. The choice of a 1 km grid size for the final output ensured that the map remained computationally efficient for national-scale planning while matching the spatial grain of the primary input data.
The uncertainty of the kriging interpolation was examined through cross-validation in ArcGIS Pro (Geostatistical Wizard), where predicted values were compared with the observed samples. The full validation metrics are presented in the Results section.
The integration of machine learning predictions with geostatistical interpolation produced a wildfire susceptibility map that is both statistically robust and spatially coherent, offering valuable insights to guide targeted fire prevention and mitigation strategies.
RESULTS
Variable Analysis and Multicollinearity
Before developing the wildfire susceptibility model, it was essential to evaluate the predictor variables to ensure their relevance to wildfire occurrence and to confirm statistical independence. Multicollinearity among explanatory variables can distort model estimates and reduce predictive reliability, especially in machine learning techniques such as Random Forest (Breiman 2001, Dormann et al. 2013). To address this, six environmental and anthropogenic variables were examined—Land Use/Land Cover (LULC), Normalized Difference Vegetation Index (NDVI), Land Surface Temperature (LST), Slope, Wind Speed, and Distance to Settlements—and their spatial distribution was analysed alongside a statistical multicollinearity assessment using Variance Inflation Factor (VIF) and tolerance values.
The spatial distributions of these predictor variables are illustrated in Figure 4, with each subfigure highlighting a specific environmental factor. Land use and land cover (Figure 4a) reflect the spatial extent of forests, agriculture, bare soil, and built-up areas, where forest-dominated zones, particularly in mountainous regions, correspond to areas of high fuel accumulation, and thus increase wildfire susceptibility (Vanderhoof and Hawbaker 2018). Normalized difference vegetation index (Figure 4b) measures vegetation density, where high NDVI values indicate dense vegetation that serves as potential fuel for aiding fire ignition and spreading. Land surface temperature (Figure 4c) captures thermal variation, with elevated temperatures in exposed lowlands and urban regions coinciding with higher ignition probabilities (Vermote et al. 2016). Terrain slope (Figure 4d) has a dual influence on wildfire dynamics; steeper slopes accelerate fire spread by promoting the preheating of upslope vegetation, whereas flatter and more accessible terrains are frequently associated with higher rates of anthropogenic fire ignition. Wind speed (Figure 4e) influences fire dynamics, increasing spread rates, and determining direction, with higher wind speeds correlating with elevated wildfire hazards (Stephens 2001). Finally, distance to settlements (Figure 4f) reflects anthropogenic ignition pressure, with areas closer to urban clusters exhibiting elevated ignition potential (Grala and D’Agata 2024).

Multicollinearity was further assessed through VIF and tolerance metrics for each predictor (Figure 5). These statistics demonstrate the degree of correlation between each variable. All six predictors exhibited VIF values between 1.45 and 3.9, well within acceptable limits (threshold < 10), and tolerance values ranged from 0.26 to 0.69, exceeding the common cutoff of 0.1 (O’Brien 2007).
 Figure 5. Variance Inflation Factor (VIF) and tolerance values for wildfire predictor variables.
For instance, NDVI (VIF = 2.54; tolerance = 0.39) and LST (VIF = 3.28; tolerance = 0.30) showed moderate correlations, as expected owing to biophysical links, but remained statistically independent. The highest degree of multicollinearity was observed in LULC (VIF = 3.81; tolerance = 0.26), whereas the lowest was found in Distance to Settlements (VIF = 1.45; tolerance = 0.69), confirming that no problematic redundancy exists within the feature set.
The combined spatial and statistical analyses confirm that the selected variables are ecologically meaningful and statistically independent. This supports their integration within the Random Forest modelling framework, ensuring stability and reliability of wildfire susceptibility predictions. Hence, the six variables—LULC, NDVI, LST, Slope, Wind Speed, and Distance to Settlements—are retained for subsequent modelling stages.
Model Performance and Cross-Validation
After validating the selected variables, the next step was to evaluate the performance of the machine learning models used in this study. To provide a clear comparison, Figure 6 summarizes the key performance metrics obtained for each model—Random Forest (RF), Classification and Regression Trees (CART), Gradient Boosting (GB), and Extreme Gradient Boosting (XGBoost)—evaluated rigorously using the 78-fold Spatial Block Cross-Validation procedure, which ensures spatial independence between training and testing data (Chen and Guestrin 2016).
Figure 6 presents both the visual bar charts and the averaged quantitative values for Accuracy, Precision, Recall, F1-Score, and the Area Under the Curve (AUC) across the 78 unseen geographic blocks. These metrics provide a comprehensive understanding of each model’s ability to correctly classify instances while accounting for both false positives and false negatives in spatially independent test regions (Sokolova and Lapalme 2009).
As detailed in Figure 6, XGBoost (Chen and Guestrin 2016) achieved the highest overall performance, with an accuracy of 90.03%, precision of 86.17%, recall of 87.10%, F1-score of 85.12%, and an outstanding spatial AUC of 0.9510. It is closely followed by Gradient Boosting and Random Forest (Breiman 2001) with CART lagging notably behind in all metrics.

Overall, based on the spatial block cross-validation results, XGBoost was identified as the best-performing model. Its superior metrics and proven ability to generalize to unseen geographic regions justify its selection for subsequent analysis and final predictions.
Wildfire Susceptibility Maps and Area Statistics
The spatial distribution of wildfire susceptibility across the study area was modelled using four machine learning approaches: Random Forest (RF) (Breiman 2001), Classification and Regression Trees (CART) (Breiman et al. 2017), Gradient Boosting (GB) (Friedman 2001), and Extreme Gradient Boosting (XGBoost) (Chen and Guestrin 2016). The resulting susceptibility maps (Figure 7) classified the territory into five fire risk categories: Very Low, Low, Medium, High, and Very High risk.
 Figure 7. Wildfire susceptibility maps derived from RF, CART, GB, and XGBoost models.
The visual examination of the wildfire susceptibility maps (Figure 7) revealed a coherent spatial distribution across all four machine learning models. Predominantly, the central and northern regions exhibit extensive areas classified as having high and very high susceptibility, corresponding closely to forested and mountainous terrains known for elevated fuel loads and complex topography (Catry et al. 2010). Importantly, isolated pockets of very high susceptibility were also evident in the southern part of the study area, underscoring localized conditions that may facilitate fire ignition and spread despite generally sparser vegetation. While the broad spatial patterns remained consistent, subtle differences in the extent and delineation of high-risk zones were apparent among the models, reflecting inherent variations in the handling of predictor interactions and algorithmic sensitivity.
To quantitatively assess these variations, the classified maps were overlaid with the national boundary, and the areal extent of each susceptibility class was calculated (Table 3). Across the models, the Very Low and Low susceptibility categories consistently covered the largest portion of the territory, jointly accounting for approximately 42%–48% of the study area. The Medium susceptibility class remained highly stable across all algorithms, representing approximately 20%–21% of the region. The high-risk zones (High and Very High combined) constituted between 30% and 36% of the landscape. Notably, XGBoost and CART allocated the highest proportion to the Very High class (19.08%), which aligns with their sensitivity to capturing extreme spatial variations in fire risk and XGBoost superior performance in the cross-validation analysis.
To synthesize these findings and reduce the uncertainty inherent in any single algorithm, an integrated wildfire susceptibility map was generated (Figure 8). This consensus map was created by aggregating and averaging the continuous probability outputs of the four machine learning models prior to the final risk classification. By combining the predictive strengths of the individual algorithms, the integrated map effectively mitigates model-specific spatial biases and provides a more robust and high-confidence delineation of wildfire-prone areas. The resulting ensemble surface reinforces the critical high-risk zones identified in the central and northern regions, establishing a highly reliable baseline for national fire management and resource allocation planning.

The probabilistic model outputs were interpolated into continuous susceptibility surfaces using the simple kriging method (Diggle et al. 2003). Cross-validation of the kriging interpolation resulted in moderate accuracy, with a Root Mean Square Error (RMSE) of 0.1462 (normalized between 0 and 1) (Chai and Draxler 2014), indicating that average prediction errors account for approximately 15% of the data range. The Mean Error (ME) was very close to zero (+0.00044), confirming the unbiased nature of the interpolated predictions. This suggests that while the interpolation effectively captures broad spatial trends, finer local variations may be less accurately represented.
Together, the wildfire susceptibility maps and area statistics highlight the pronounced spatial heterogeneity of fire risk in the region. Although all models broadly agree on the identification of northern and central hotspots, the creation of an integrated consensus map provides the most actionable insight for prioritizing fire-prevention strategies. Among the individually tested algorithms, XGBoost emerged as the most robust, whereas the integrated ensemble approach offered the highest degree of spatial reliability.
Permutation Feature Importance
To better understand the contribution of each explanatory factor in shaping wildfire susceptibility, a feature importance analysis was performed using the model-agnostic permutation importance technique (Altmann et al. 2010). This approach quantifies the strength of influence of each variable by measuring the decrease in model performance (AUC) when a specific predictor is randomly shuffled, thereby providing unbiased insights into the ecological and environmental drivers of wildfire risks without the biases inherent to traditional tree-based impurity scores.
The results summarized in Figure 9 show the relative importance of the six predictor variables across the four classifiers (Random Forest, CART, Gradient Boosting, and XGBoost). Two consistent patterns can be observed:
- NDVI (vegetation greenness) was the most influential variable across nearly all models, highlighting the central role of vegetation density and fuel availability in the occurrence of wildfires (Chuvieco et al. 2008).
- Slope and LULC were ranked as secondary but critical predictors, indicating that topography and land cover structure also strongly modulate susceptibility patterns and fire behaviour.
- LST and wind speed contributed moderately, reflecting their roles as climatic and micro-environmental conditions that influence ignition probability and spread rates.
- The distance to settlements generally showed the lowest influence, although it was still non-negligible. This suggests that while anthropogenic proximity is a factor, it is less dominant than biophysical and topographic conditions in determining overall susceptibility in this region.

The exclusive use of permutation importance strengthens the robustness of these results. Because it measures the actual predictive loss on unseen data when a variable's spatial structure is broken, it provides a highly reliable metric of variable influence (Tonini et al. 2020). Together, these analyses confirm that vegetation condition (NDVI), terrain (slope), and land cover type (LULC) are the most decisive factors driving wildfire susceptibility in the study area. This provides valuable ecological insight into both the spatial drivers of fire risks and the interpretability of machine learning predictions.
DISCUSSION
The findings of this study offer significant insights into the spatial patterns and primary determinants of wildfire susceptibility in Portugal. In contrast to numerous prior studies that predominantly utilized a single machine learning classifier, this study systematically compared four algorithms—Random Forest, Classification and CART, Gradient Boosting, and XGBoost—and synthesized them into an integrated ensemble map. This comparative framework enhances model reliability and contributes to the expanding body of literature that assesses the strengths and limitations of ensemble learning approaches for wildfire prediction (Bjånes et al. 2021, Bhowmik et al. 2023).
The analysis of variable importance, evaluated using robust permutation techniques, indicated that vegetation-related factors, particularly NDVI and LULC, were the most influential predictors of wildfire susceptibility in the study area. These findings align with ecological studies that highlight the role of fuel availability and type in influencing ignition likelihood and fire spread (Fernandes and Botelho 2003, Parente et al. 2018). Topographic variables such as slope and climatic variables, including wind speed, were also significant, corroborating their well-established influence on fire behaviour (Parisien et al. 2016). The relatively lower weight of anthropogenic variables, such as distance to settlements, suggests that biophysical conditions remain the dominant drivers of susceptibility in Portugal.
Model performance evaluation confirmed the superior predictive capability of the ensemble techniques, with XGBoost achieving the highest accuracy (90.03%), followed by Spatial AUC (0.9510). These values are comparable to, and in some cases exceed, those reported in recent wildfire susceptibility studies across the Mediterranean and other fire-prone landscapes (Chuvieco et al. 2019, Rodrigues et al. 2021). The high predictive skill demonstrates the ability of XGBoost to capture complex, nonlinear relationships between environmental conditions and fire occurrence.
These results are highly consistent with recent advancements in wildfire susceptibility mapping that utilize similar machine learning frameworks across diverse geographic contexts. For instance, Thies (2025) achieved high predictive accuracies using machine learning models in Germany, highlighting the broad robustness of these algorithms. Similarly, Durlević et al. (2025) demonstrated that the fusion of multi-sensor satellite data with machine learning models yielded exceptional susceptibility maps in Serbia, reinforcing the value of integrating high-resolution topographic and climatic variables. Furthermore, Sapkota et al. (2025) successfully advanced wildfire prediction in Nepal using machine learning, echoing our findings that ensemble methods, such as XGBoost, which are highly adept at capturing nonlinear environmental drivers across complex terrains.
Given the exceptionally high predictive performance (AUC > 0.95), it is important to note that such metrics can sometimes raise concerns regarding model overfitting. However, the strict implementation of the 78-fold Spatial Block Cross-Validation in this study explicitly prevented spatial data leakage, ensuring that the model's accuracy reflected true predictive power rather than geographic memorization. Therefore, the high score is likely driven by the stark biophysical contrasts inherent to the Portuguese landscape, specifically to the sharp ecological dichotomy between the highly flammable, densely forested northern topographies and the more fuel-limited southern plains. This clear geographic separation makes the binary classification of fire presence/absence highly distinct for advanced tree-based algorithms such as XGBoost.
The final susceptibility maps consistently identified the northern and central interior regions as the most fire-prone, which is in line with historical fire records and prior research on Portuguese fire regimes (Calheiros et al. 2022, European Commission Joint Research Centre 2023). Quantitative area statistics further underscored the dominance of the Very High susceptibility category in these zones. These outputs not only validate the modelling framework but also offer actionable insights into fire management, land-use planning, and resource prioritization.
Nevertheless, certain limitations must be acknowledged. The uniform 1 km spatial resolution of certain variables, such as LST and wind speed, while appropriate for national-scale kriging interpolation, may not capture critical micro-scale heterogeneity in topography and fuel types. Furthermore, the fire occurrence dataset may be subject to sampling bias and under-reporting. Finally, although wildfire dynamics are inherently temporal, the explanatory variables used in this study represent static snapshots.
This static approach, which does not account for seasonal droughts or shifting human activity over time, represents a simplification of real-world complexity and could influence the model’s predictive precision at the local scale. Future research should integrate higher-resolution environmental datasets, adopt multi-temporal variables to account for seasonal variability, and test hybrid approaches that combine remote sensing with socio-economic drivers to build a more comprehensive and robust model.
CONCLUSIONS
This study demonstrated the efficacy of machine learning, with a particular focus on XGBoost, in mapping wildfire susceptibility in Portugal. Through a systematic comparison of four classifiers, rigorous spatial block cross-validation, and the creation of an integrated consensus map, this study confirmed that vegetation (NDVI, LULC) and topography (slope) are the primary determinants of fire occurrences. A key contribution of this research is the methodological shift from traditional random cross-validation toward a strict spatial blocking approach, which effectively eliminates spatial data leakage and provides a more honest, ecologically valid assessment of model generalization.
The practical applicability of these findings is highly relevant to national and regional decision-makers. The resulting susceptibility maps, which clearly identify northern and central Portugal as the most critical risk zones, provide a data-driven baseline for institutions such as the Portuguese National Authority for Emergency and Civil Protection (ANEPC), the Institute for Nature Conservation and Forests (ICNF), and local municipal planning boards. By utilizing the integrated ensemble map, these agencies can optimize the allocation of limited firefighting resources during the peak summer fire season.
Furthermore, the identification of specific environmental drivers directly informs the development of targeted wildfire protection measures. As vegetation density (NDVI) and land cover (LULC) were identified as the most dominant risk factors, land managers can implement proactive mitigation strategies. These include targeted fuel reduction treatments, the establishment of controlled prescribed burns, and the creation of strict buffer zones (firebreaks) around wildland-urban interfaces (WUI) in the Very High susceptibility zones. Additionally, early warning systems and localized monitoring can be enhanced in areas where steep slopes and high wind speeds intersect with dense-forest cover.
Despite certain limitations related to the variable spatial resolution and static nature of the environmental datasets, the framework provides highly reliable and transferable tools for supporting fire management, land-use planning, and risk reduction. Future research should incorporate finer-scale, multi-temporal environmental, and socioeconomic data to further enhance predictive performance and capture the dynamic nature of fire regimes.
Author Contributions
MAL conceived and designed the study, performed data collection and processing, implemented the machine learning models, conducted the analysis, and wrote the manuscript. MA contributed to maps preparation, supervised the research, and revised the manuscript. BA supervised the research and contributed to manuscript revision. All authors have read and approved the final version of the manuscript.
Funding
This research did not receive any external funding.
Acknowledgments
The authors would like to thank the Ibn Tofail University, Faculty of Humanities and Social Sciences, Department of Geography, for providing academic support. We also acknowledge the use of Google Earth Engine and Google Colab platforms for data processing and analysis.
Competing Interests
The authors declare no competing interests.
REFERENCES
Ahmed RR, Streimikiene D, Streimikis J, Siksnelyte-Butkiene I, 2024. A comparative analysis of multivariate approaches for data analysis in management sciences. E+M Ekon Manag 27(1): 192–210. https://doi.org/10.15240/tul/001/2024-5-001.
Almeida P, Menezes IC, Miranda AI, 2024. A Human Behavior Wildfire Ignition Probability Index for Application to Mainland Portugal. Fire 7(12): 447. https://doi.org/10.3390/fire7120447.
Altmann A, Toloşi L, Sander O, Lengauer T, 2010. Permutation importance: A corrected feature importance measure. Bioinformatics 26(10): 1340–1347. https://doi.org/10.1093/bioinformatics/btq134.
Bhowmik RT, Jung YS, Aguilera JA, Prunicki M, Nadeau K, 2023. A multi-modal wildfire prediction and early-warning system based on a novel machine learning framework. J Environ Manag 341: 117908. https://doi.org/10.1016/j.jenvman.2023.117908.
Bjånes A, De La Fuente R, Mena P, 2021. A deep learning ensemble model for wildfire susceptibility mapping. Ecol Inform 65: 101397. https://doi.org/10.1016/j.ecoinf.2021.101397.
Breiman L, 2001. Random Forests. Mach Learn 45(1): 5–32. https://doi.org/10.1023/A:1010933404324.
Breiman L, Friedman JH, Olshen RA, Stone CJ, 2017. Classification and Regression Trees. 1st Edition. Routledge, New York, USA, 368. https://doi.org/10.1201/9781315139470.
Brown CF, Brumby SP, Guzder-Williams B, Birch T, Hyde SB, Mazzariello J, Czerwinski W, Pasquarella VJ, Haertel R, Ilyushchenko S, Schwehr K, Weisse M, Stolle F, Hanson C, Guinan O, Moore R, Tait AM, 2022. Dynamic World, Near real-time global 10 m land use land cover mapping. Sci Data 9(1): 251. https://doi.org/10.1038/s41597-022-01307-4.
Calheiros T, Benali A, Pereira M, Silva J, Nunes J, 2022. Drivers of extreme burnt area in Portugal: Fire weather and vegetation. Nat Hazards Earth Syst Sci 22(12): 4019–4037. https://doi.org/10.5194/nhess-22-4019-2022.
Catry FX, Rego F, Moreira F, Fernandes PM, Pausas JG, 2010. Post-fire tree mortality in mixed forests of central Portugal. For Ecol Manag 260(7): 1184–1192. https://doi.org/10.1016/j.foreco.2010.07.010.
Central Intelligence Agency, 2025. The World Factbook: Portugal. Available online: https://www.cia.gov/the-world-factbook/countries/portugal/.
Chai T, Draxler RR, 2014. Root mean square error (RMSE) or mean absolute error (MAE)? – Arguments against avoiding RMSE in the literature. Geosci Model Dev 7(3): 1247–1250. https://doi.org/10.5194/gmd-7-1247-2014.
Chen T, Guestrin C, 2016. XGBoost: A Scalable Tree Boosting System. In: Proceedings of the 22nd ACM SIGKDD International Conference on Knowledge Discovery and Data Mining, San Francisco, CA, USA, 13–17 August 2016. ACM, New York, USA, 785–794. https://doi.org/10.1145/2939672.2939785.
Chuvieco E, Giglio L, Justice C, 2008. Global characterization of fire activity: Toward defining fire regimes from Earth observation data. Glob Change Biol 14(7): 1488–1502. https://doi.org/10.1111/j.1365-2486.2008.01585.x.
Chuvieco E, Mouillot F, Van Der Werf GR, San Miguel J, Tanase M, Koutsias N, García M, Yebra M, Padilla M, Gitas I, Heil A, Hawbaker TJ, Giglio L, 2019. Historical background and current developments for mapping burned area from satellite Earth observation. Remote Sens Environ 225: 45–64. https://doi.org/10.1016/j.rse.2019.02.013.
Cressie NAC, 1993. Statistics for Spatial Data. 1st Edition. Wiley, New York, USA. https://doi.org/10.1002/9781119115151.
Diggle PJ, Ribeiro PJ, Christensen OF, 2003. An Introduction to Model-Based Geostatistics. In: Møller J (eds) Spatial Statistics and Computational Methods. Springer, New York, USA, 43–86. https://doi.org/10.1007/978-0-387-21811-3_2.
Dormann CF, Elith J, Bacher S, Buchmann C, Carl G, Carré G, Marquéz JRG, Gruber B, Lafourcade B, Leitão PJ, Münkemüller T, McClean C, Osborne PE, Reineking B, Schröder B, Skidmore AK, Zurell D, Lautenbach S, 2013. Collinearity: A review of methods to deal with it and a simulation study evaluating their performance. Ecography 36(1): 27–46. https://doi.org/10.1111/j.1600-0587.2012.07348.x.
Durlević U, Ilić V, Valjarević A, 2025. Wildfire Susceptibility Mapping Using Deep Learning and Machine Learning Models Based on Multi-Sensor Satellite Data Fusion: A Case Study of Serbia. Fire 8(10): 407. https://doi.org/10.3390/fire8100407.
El Mazi M, Boutallaka M, Saber E, Chanyour Y, Bouhlal A, 2024. Forest fire risk modeling in Mediterranean forests using GIS and AHP method: Case of the high Rif forest massif (Morocco). Euro-Mediterr J Environ Integr 9(3): 1109–1123. https://doi.org/10.1007/s41207-024-00591-3.
Esri, 2025. ArcGIS Pro (Geostatistical Analyst extension), Version 3.3. Available online: https://www.esri.com/en-us/arcgis/products/arcgis-pro/overview.
European Commission, Joint Research Centre (JRC), 2025. Current wildfire situation in Europe. Available online: https://joint-research-centre.ec.europa.eu/projects-and-activities/natural-and-man-made-hazards/fires/current-wildfire-situation.
European Commission, Joint Research Centre (JRC), 2023. Advance report on forest fires in Europe, Middle East and North Africa 2022. Publications Office, Luxembourg. https://data.europa.eu/doi/10.2760/091540.
European Commission, Joint Research Centre (JRC), 2024. GHSL country statistics by degree of urbanization: Public release of GHS COUNTRY STATS R2024A. Publications Office, Luxembourg. https://data.europa.eu/doi/10.2760/0075418.
Eurostat, 2025. Land cover statistics for Portugal. Available online: https://ec.europa.eu/eurostat/statistics-explained/index.php/Land_cover_statistics.
Farr TG, Rosen PA, Caro E, Crippen R, Duren R, Hensley S, Kobrick M, Paller M, Rodriguez E, Roth L, Seal D, Shaffer S, Shimada J, Umland J, Werner M, Oskin M, Burbank D, Alsdorf D, 2007. The Shuttle Radar Topography Mission. Rev Geophys 45(2): 2005RG000183. https://doi.org/10.1029/2005RG000183.
Fernandes PM, Botelho HS, 2003. A review of prescribed burning effectiveness in fire hazard reduction. Int J Wildland Fire 12(2): 117–128. https://doi.org/10.1071/WF02042.
Friedman JH, 2001. Greedy function approximation: A gradient boosting machine. Ann Stat 29(5): 1189–1232. https://doi.org/10.1214/aos/1013203451.
Grala RK, D'Agata PJ, 2024. Assessing human-caused wildfire risk using GIS. Fire Manag Today 82(1): 12–18.
Hastie T, Tibshirani R, Friedman J, 2009. The Elements of Statistical Learning. 2nd Edition. Springer, New York, USA. https://doi.org/10.1007/978-0-387-84858-7.
ICNF (Instituto da Conservação da Natureza e das Florestas), 2025. Estatísticas dos Incêndios Rurais (Rural Fire Statistics). ICNF, Lisbon, Portugal.
Jaafari A, Pourghasemi HR, 2019. Factors Influencing Regional-Scale Wildfire Probability in Iran. In: Pourghasemi HR, Gokceoglu C (eds) Spatial Modeling in GIS and R for Earth and Environmental Sciences. Elsevier, Amsterdam, Netherlands, 607–619. https://linkinghub.elsevier.com/retrieve/pii/B9780128152263000284.
Muñoz-Sabater J, Dutra E, Agustí-Panareda A, Albergel C, Arduini G, Balsamo G, Boussetta S, Choulga M, Harrigan S, Hersbach H, Martens B, Miralles DG, Piles M, Rodríguez-Fernández NJ, Zsoter E, Buontempo C, Thépaut JN, 2021. ERA5-Land: A state-of-the-art global reanalysis dataset for land applications. Earth Syst Sci Data 13(9): 4349–4383. https://doi.org/10.5194/essd-13-4349-2021.
O'Brien RM, 2007. A Caution Regarding Rules of Thumb for Variance Inflation Factors. Qual Quant 41(5): 673–690. https://doi.org/10.1007/s11135-006-9018-6.
Oliveira S, Zêzere JL, 2020. Assessing the biophysical and social drivers of burned area distribution at the local scale. J Environ Manag 264: 110449. https://doi.org/10.1016/j.jenvman.2020.110449.
O'Sullivan D, Unwin DJ, 2010. Geographic Information Analysis. 1st Edition. Wiley, Hoboken, USA. https://doi.org/10.1002/9780470549094.
Parente J, Pereira MG, Amraoui M, Fischer EM, 2018. Heat waves in Portugal: Current regime, changes in future climate and impacts on extreme wildfires. Sci Total Environ 631–632: 534–549. https://doi.org/10.1016/j.scitotenv.2018.03.044.
Parisien MA, Miller C, Parks SA, DeLancey ER, Robinne FN, Flannigan MD, 2016. The spatially varying influence of humans on fire probability in North America. Environ Res Lett 11(7): 075005. https://doi.org/10.1088/1748-9326/11/7/075005.
Rodrigues M, Mariani M, Russo A, Salis M, Galizia LF, Cardil A, 2021. Spatio-Temporal Domains of Wildfire-Prone Teleconnection Patterns in the Western Mediterranean Basin. Geophys Res Lett 48(19): e2021GL094238. https://doi.org/10.1029/2021GL094238.
Sapkota S, Joshi KP, Kuikel S, Kuinkel D, Bhandari B, Wu Y, Bing H, Marahatta S, Aryal D, Wang SYS, Pokharel B, 2025. Advancing wildfire prediction in Nepal using machine learning algorithms. Environ Res Commun 7(5): 055003. https://doi.org/10.1088/2515-7620/add2db.
Seabold S, Perktold J, 2010. Statsmodels: Econometric and Statistical Modeling with Python. In: Proceedings of the 9th Python in Science Conference, Austin, TX, USA, 28 June–3 July 2010. SciPy, Austin, USA, 92–96. https://doi.org/10.25080/Majora-92bf1922-011.
Sokolova M, Lapalme G, 2009. A systematic analysis of performance measures for classification tasks. Inf Process Manag 45(4): 427–437. https://doi.org/10.1016/j.ipm.2009.03.002.
Stephens SL, 2001. Fire history differences in adjacent Jeffrey pine and upper montane forests in the eastern Sierra Nevada. Int J Wildland Fire 10(2): 161–167. https://doi.org/10.1071/WF01008.
Tang X, Machimura T, Li J, Yu H, Liu W, 2022. Evaluating Seasonal Wildfire Susceptibility and Wildfire Threats to Local Ecosystems in the Largest Forested Area of China. Earth's Future 10(5): e2021EF002199. https://doi.org/10.1029/2021EF002199.
Thies B, 2025. Machine learning wildfire susceptibility mapping for Germany. Nat Hazards 121(11): 12517–12530. https://doi.org/10.1007/s11069-025-07292-2.
Tonini M, D'Andrea M, Biondi G, Degli Esposti S, Trucchia A, Fiorucci P, 2020. A Machine Learning-Based Approach for Wildfire Susceptibility Mapping. The Case Study of the Liguria Region in Italy. Geosciences 10(3): 105. https://doi.org/10.3390/geosciences10030105.
Turco M, Jerez S, Augusto S, Tarín-Carrasco P, Ratola N, Jiménez-Guerrero P, Trigo RM, 2019. Climate drivers of the 2017 devastating fires in Portugal. Sci Rep 9(1): 13886. https://doi.org/10.1038/s41598-019-50281-2.
Vanderhoof MK, Hawbaker TJ, 2018. It matters when you measure it: Using snow-cover Normalised Difference Vegetation Index (NDVI) to isolate post-fire conifer regeneration. Int J Wildland Fire 27(12): 815–828. https://doi.org/10.1071/WF18075.
Verde JC, Zêzere JL, 2010. Assessment and validation of wildfire susceptibility and hazard in Portugal. Nat Hazards Earth Syst Sci 10(3): 485–497. https://doi.org/10.5194/nhess-10-485-2010.
Vermote E, Justice C, Claverie M, Franch B, 2016. Preliminary analysis of the performance of the Landsat 8/OLI land surface reflectance product. Remote Sens Environ 185: 46–56. https://doi.org/10.1016/j.rse.2016.04.008.
Wan Z, Hook S, Hulley G, 2021. MODIS/Terra Land Surface Temperature/Emissivity 8-Day L3 Global 1km SIN Grid V061. NASA Land Processes Distributed Active Archive Center. https://doi.org/10.5067/MODIS/MOD11A2.061.
© 2026 by the author(s). License: Croatian Forest Research Institute. This article is an open access article distributed under the terms and conditions of the Creative Commons Attribution 4.0 International License (CC BY 4.0).