
SEEFOR 12(1): 1-11
Article ID: 2104
DOI: https://doi.org/10.15177/seefor.21-04
ORIGINAL SCIENTIFIC PAPER
Height to Crown Base Modelling for the Main Tree Species in an Even-Aged Pedunculate Oak Forest: A Case Study from Central Croatia
Saray Martín-García1,2,*, Ivan Balenović3, Luka Jurjević3, Iñigo Lizarralde1,4, Krunoslav Indir3,5, Rafael Alonso Ponce1,4
(1) föra forest technologies SLL, Campus Duques de Soria s/n, ES-42004 Soria, Spain;
(2) Universidade de Santiago de Compostela, Departamento de Enxeñaría Agroforestal, Biodiversity-LaboraTe-IBADER, ES-27001 Lugo, Spain;
(3) Croatian Forest Research Institute, Division for Forest Management and Forestry Economics, Trnjanska cesta 35, HR-10000 Zagreb, Croatia;
(4) Sustainable Forest Management Research Institute, University of Valladolid-INIA, Campus Duques de Soria s/n, ES-42004 Soria, Spain;
(5) Croatian Forest Research Institute, Research Centre for Urban and Private Forests, Vilka Novaka 50c, HR-42000 Varaždin, Croatia
Citation: Martín-García S, Balenović I, Jurjević L, Lizarralde I, Indir K, Alonso Ponce R, 2021. Height to Crown Base Modelling for the Main Tree Species in Even-Aged Pedunculate Oak Forest: A Case Study from Central Croatia. South-east Eur for 12(1): 1-11. https://doi.org/10.15177/seefor.21-04.
Received: 15 Feb 2021; Revised: 24 Mar 2021; Accepted: 26 Mar 2021; Published online: 15 Apr 2021
Cited by: Crossref Google Scholar
Abstract
The height to crown base (hcb) is a critical measure used in many investigations as an input variable to investigate the vigour of the stands, the social position of the trees, and to evaluate the behaviour of forest fires, among other uses. Though measuring height-related variables in the field is always time-consuming, the foremost benefits offered by modelling hcb are that it permits to generalize and average a very uneven attribute and, furthermore, provides insights about which tree and stand variables have a significant impact on hcb. However, there are many species in which models of the crown base height have not been developed in Croatia. The objective of this research was to develop a height to base crown model for each of the main species present in the two-layered mixed stands of this study. According to previous investigations, logistic models provide the highest precision and require the lowest inventory cost owing to less frequent measurements. Tree- and plot-level variables with distance-independent competition indexes were studied in the fitting model. In this research, we obtained models for the main stand species: Acer campestre (root mean squared error (RMSE) = 2.28 m, R2 = 82.80%); Alnus glutinosa (RMSE = 1.78 m, R2 = 85.36%); Carpinus betulus (RMSE = 2.47 m, R2 = 67.55%); Fraxinus angustifolia (RMSE = 2.46 m, R2 = 82.45%); Quercus robur (RMSE = 2.60 m, R2 = 80.57%); Tilia sp. (RMSE = 2.01 m, R2 = 89.07%); and Ulmus laevis (RMSE = 1.71 m, R2 = 92.42%). The combination of the total height, tree, and plot-level variables with distance-independent competition indexes contributed to the prediction accuracy of proposed model significantly.
Keywords: two-layered mixed stands; distance-independent competition indexes; logistic models; leave-one-out cross-validation.
INTRODUCTION
Tree crowns are involved in many key physiological processes, such as photosynthesis (Ma et al. 2017, Liu et al. 2019), respiration (Plain et al. 2009, Drake et al. 2016), and transpiration (Köstner et al. 1992, Gupta et al. 2018), and they also influence soil water storage (Meinzer et al. 1999, Zhang et al. 2007) and the interception of radiation (Stenberg et al. 1994, Chen et al. 2017), being the most important part of the tree.
The crown structure also affects the biomass productivity (Valentine et al. 1994, Russell and Weiskittel 2011), stem form, and wood quality (Maguire et al. 1991, Hein et al. 2008) and individual tree competition status (Kershaw et al. 1990, Cameron et al. 2020). The crown structure includes decisive parameters to assess the crown fuel characteristics that influence potential crown fire behaviour (Cruz et al. 2003, Ruiz-González and Álvarez-González 2011, Jiménez et al. 2013).
Therefore, these metrics are critically important for informing forest management (Li et al. 2020). However, crown measurements require an appropriate abstraction of crown size and shape; however, direct measurement of the crown shape or profile is difficult (Cameron et al. 2020). In addition, the labour-intensive and time- and money-consuming endeavour of measuring descriptive crown parameters hinders the wide application to forest management (Hasenauer and Monserud 1996, Fu et al. 2017, Luo et al. 2018) particularly in mixed stands.
This has motivated many studies to focus their efforts on modelling crown parameters, such as tree height to crown base (hcb). hcb is an important variable often included as a predictor in various forest models that serve as the fundamental tools for decision-making in forestry (Sharma et al. 2017). hcb reports important information to assess the social position of the trees and the competition they suffer, closely related to the crown size and may affect the tree vigour (Hasenauer and Monserud 1996, Fu et al. 2013). Although traditional field-based methods can obtain reliable and accurate hcb measurements (Dean et al. 2009, S. Luo et al. 2016), it is rarely measured in the field and it is often predicted using static models (Rijal et al. 2012).
hcb models for many tree species have been developed from data at the tree and plot level using: (1) basic models methods (Rijal et al. 2012, Fu et al. 2017, Sharma et al. 2017, Jia and Chen 2019, Pan et al. 2020) to obtain high precision models with low field inventory cost, and (2) mixed-effects models (Fu et al. 2017, Jia and Chen 2019, Pan et al. 2020), which have been widely used in recent years as they show an increase prediction accuracy to an extent (Jia and Chen 2019, Pan et al. 2020).
The variability of hcb has been evaluated through three groups of variables: (1) tree size metrics referred to as tree-level variables, (2) variables of the size and vigour of the plot or stand denominated as plot-level variables, and (3) variables of the site quality and distance-independent competition indexes. For instance, the dominant height is usually used to describe the site quality and the stand development age, since it is strongly correlated with the growth condition of the dominant trees (Fu et al. 2017, Sharma et al. 2017, Li et al. 2020, Pan et al. 2020), and the total basal area of all trees with a diameter larger than the target tree is usually used to assess competition effects (Fu et al. 2017). These variables have been used combined or separately in many studies (Rijal et al. 2012, Fu et al. 2017, Pan et al. 2020).
In this work, hcb is defined as the height from the ground to the base of the first living branch that is a part of the crown, ranging from 0 to the height of the tree (Rijal et al. 2012, Fu et al. 2017). This must be differentiated from the concept of the Canopy Base Height, a parameter used in the study of forest fires, which represents the mean vertical distance, in meters, between the ground and the beginning of the living canopy at which there is enough fuel to spread the fire vertically through the canopy (Scott and Reinhardt 2001).
Although hcb is often assessed in research or monitoring (e.g., International Co-operative Programme on Assessment and Monitoring of Air Pollution Effects on Forests (ICP Forests)) projects, in general, hcb modelling was not a research focus in Croatia. Such models were often not validated. The objectives of this study were (i) to develop species-specific hcb logistic models for the main tree species in the mixed, lowland pedunculate oak (Quercus robur L.) forests in Central Croatia; and (ii) to study which variables best explain the variability of hcb for each species and how each group of variables (tree-, plot-, and competition-distance index variables) affects the accuracy of the models. Mixed pedunculate oak forests are among the most important forest ecosystems in Croatia with exceptional ecological, economical, and sociological significance (Novotny et al. 2013). Pedunculate oak is also a key tree species of European forests (Čater 2015). Despite these facts and to the best of authors knowledge, there were no previous studies dealing with hcb modelling in pedunculate oak forest ecosystems.
MATERIALS AND METHODS
Study Area
The study area is located in the continental part of Croatia, near Jastrebarsko and 35 km southwest of Zagreb, within the Pokupsko Basin lowland forest complex (≈12,000 ha, Figure 1). The forests of the study area consist of even-aged pedunculate oak stands mixed with other tree species: common hornbeam (Carpinus betulus L.), black alder (Alnus glutinosa (L.) Gaertn.), and narrow-leaved ash (Fraxinus angustifolia Vahl.). Other tree species that sporadically occur are Ulmus laevis Pall., Tilia sp., Populus sp., Acer campestre L., Betula pendula Roth., Pyrus pyraster (L.) Burgsd., etc. These stands commonly have a two-layered structure (a dominant and suppressed tree layer) with pedunculate oak in the dominant crown class layer and other tree species in the suppressed crown class layer. The understorey is dominated by two shrub species: hazel (Corylus avellana L.) and common hawthorn (Crataegus monogyna Jacq.), while alder buckthorn (Frangula alnus Mill.) occurs sporadically. The terrain of the study area is mostly flat (105–118 m a.s.l.). Soils are hydromorphic (hypogley, eugley, and pseudogley) on a clay parent material. The climate is warm temperate with the mean annual temperature of 10.6 °C and precipitation of 962 mm·y-1 (Ostrogović Sever et al. 2019).
The pedunculate oak forests of the study area are state-owned, and they are actively managed for sustained timber in 140 year-long rotations, ending with two or three regeneration fellings during the last 10 years of the rotation. This management approach provides sustainability in terms of the yield, biodiversity, and ecosystem stability (Klepac and Fabijanić 1996). It has been applied for all even-aged pedunculate oak forests in Croatia where they cover an area of 225.000 ha or 9% of the total forest area (Croatian Forests Ltd. 2016). Further detailed information on sustainable management of pedunculate oak forests in Croatia can be found in Ostrogović Sever et al. (2019).
Field Measurements
Field data were collected from a total of 164 circular sample plots during 2017. The plots were systematically distributed throughout the study area, i.e., within the 30 stands of different age classes and with a total area of 576.32 ha. The radius of plots (8, 12, and 15 m) and systematic distance between the plots (100 × 100, 100 × 200, and 200 × 200 m) were defined in respect to the stand age and size. The positions of the plot centres were recorded during the leaf-off conditions (beginning of March 2017) using a Global Navigation Satellite Systems (GNSS) receiver (Stonex S9IIIN) connected to a network of GNSS reference stations (the Croatian Positioning System (CROPOS)) to achieve high positional accuracy. The average receiver reported precision of the plots positioning was 0.13 m (Balenović et al. 2019).
At each plot, the tree species and its location were recorded, and the diameters at breast height (dbh) were measured for all trees with dbh ≥ 10 cm. The position of each tree in the plot was recorded by measuring the distance and azimuth from the plot centre to each tree using a Vertex III hypsometer and Haglöf compass, respectively. Out of 4953 trees sampled within the 164 plots, the tree height was measured for 3247 trees using a Vertex III hypsometer, while the heights of the rest of the trees were estimated using the species-specific dbh-height models fitted with Michailloff’s function (Michailoff 1943). In addition to the total tree height, the height from the bottom of the tree to the first live branch, i.e., the hcb, was measured for 3163 trees that were subsampled from trees with height measurements. A summary of the main forest attributes for the entire sample of 164 plots used for developing hcb models at tree-level is presented in Table 1. The plot-level volume values in Table 1 refers to the merchantable tree volume comprising of stemwood and branchwood up to a diameter of 7 cm overbark. It was calculated for each sampled tree using the Schumacher-Hall equation (Schumacher and Hall 1933) and parameters from Croatian two-entry (dbh and height) volume tables (Špiranec 1975, Cestar and Kovačić 1981, 1982, 1984), and summarized at plot-level.
Development and Validation of Tree Height to Crown Base (hcb) Models
Species-specific hcb models were developed for all species present in the dataset consisting of 164 sample plots. A model was adjusted for all species that had at least 20 trees measured in the field. The models were fitted with the outliers removed (Montgomery 2009).
For model development, the logistic equation of Walters and Hann (1986) (Equation 1) was used: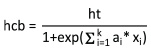
where ht is the total height of the tree, ai are model pa-rameters to be estimated, and xi are plot-, tree-level, or competition explanatory variables (Table 2). The hcb values in this equation are constrained to be less than the total height and greater or equal to zero (Ritchie and Hann 1987). This equation presents several advantages over other crown base height equations. First, it is well constrained and should, thus, be a more reliable expression of the true relationships between crown length and the predictor variables; second, this equation provides slightly better fits than similar equations; and third, it is more easily interpreted than other crown base height equations (Ritchie and Hann 1987).
In addition to field-measured tree-level variables (e.g., the dbh and total tree height), various plot-level metrics and distance-independent competition indexes (Table 2) were calculated from field data and considered in hcb modelling. A total of 17 potential explanatory variables were included in the statistical modelling.
Variable selection was performed in R 3.6.2 (R Core Team 2019) through a stepwise procedure with the linearized form of Equation 1 using the step function from the stats package (R Core Team 2019). This function eliminates predictors one at a time, until it finds the optimum Akaike Information Criterion (AIC) value. Next, the selected independent variables were included in the original form of the equation, and the model was fitted by nonlinear least squares with the 'nls' function from the stats package (R Core Team 2019).
The models were selected and inspected graphically and evaluated numerically through the root mean squared error (RMSE), both absolute and relative; mean error (BIAS) in percentage and its p-value to assess whether it is significantly different from 0; EF: the model efficiency in percentage; and coefficient of correlation (R2) of the observed versus predicted results in percentage. Finally, to avoid overfitting, the 'vif' function of the package car (Fox and Weisberg 2019) was applied to select the most parsimonious model.
Leave-one-out cross-validation (LOOCV) was used to assess the predictive value of each regression model (Picard and Cook 1984, Varma and Simon 2006). The LOOCV was chosen because certain tree species had a smaller number of field measurements, which disabled dividing them into modelling and validation subsets. For this purpose, the root mean squared error for cross-validation (RMSECV): absolute (m), and relative (%); mean error (BIASCV); and its p-value were used to assess whether it the LOOCV significantly different from 0.
RESULTS AND DISCUSSION
The species-specific hcb models (Table 3) were developed for seven tree species (A. campestre, A. glutinosa, C. betulus, F. angustifolia, Q. robur, Tilia sp., and U. laevis) that had at least 20 trees measured in the field. Other species (Populus sp., B. pendula, and P. pyraster), that had fewer measurements, were not included in any model.
Table 3 displays a statistical summary of all the predictor variables per model. The crown base heights to be predicted varied remarkably among species, motivated by their different morphologies and bioecologies, with the minimum inventoried being 0.30 m for A. glutinosa and the maximum of 32.10 m for Q. robur. The independent parameters that are repeated in different models varied considerably among species, which gives an idea of the great variability present in the study area. N is the variable with the highest dispersion for the two models in which it has been used as a predictor, followed by AGE and bal in the third place. The maximum ht values show how Q. robur, F. angustifolia, and C. betulus are the species that reached the highest heights and, therefore, the dominant species in the study area.
ht and dbh predictors have been used as the main predictor in many hcb modelling studies (Fu et al. 2017, Sharma et al. 2017, Pan et al. 2020). Instead, we only used ht as the main predictor in the base model (see Equation 1), and dbh did not enter any of the evaluated models. The hcb models used ht plot-level variables with tree-level variables and distance-independent competition indexes.
Table 4 incorporates the hcb model performances. The results showed accuracies between 67.55% (C. betulus) and 92.42% (U. laevis) of R2 and p.BIAS between 0.7115 (U. laevis) and 0.9488 (F. angustifolia). The RMSE ranged from 12.02% for A. glutinosa to 34.05% for C. betulus. One of the reasons for the greater variation among the models’ performances may be the intraspecific morphology diversity since some species present higher heterogeneity among their crowns than others. Namely, the number of sampled trees differ from species to species; they were collected from forest stands of different ages where certain species may have different status (e.g., dominant, co-dominant, intermediate, suppressed layers) and consequently form different crown shapes and dimensions. Thus, the C. betulus hcb model clearly performed worse than the rest of the species and had the highest relative RMSE associated.
In view of these results, the models developed were unbiased, and they adequately explained the variations in the height to crown base. While it is true that the models offer good results, some models have been built with small samples and should be applied carefully, particularly A. campestre (27 trees), which shows a narrow interval of stand density (IH 13.1-25.2). Nevertheless, in the case of U. laevis (21 trees), the range of variation of both the predicted and explanatory variables is quite wide, which makes the fitted equation suitable for a broad spectrum of stands.
In this study, a high correlation was found among plot variables, the distance-independent competition index, and the hcb for each species. The plot variables gave rise to the most accurate models, since hcb is a dimensional measurement of a tree and since it is more strongly correlated with other dimensional measures (Rijal et al. 2012), whereas competition measures better describe competitive interactions among species (Petritan et al. 2007, Thorpe et al. 2010, Sharma et al. 2017).
Distance-independent competition indexes originate models whose accuracies are conditioned by intra- and inter-species competition and stages of development, originating more variable precisions that depend on the intimate mixture of trees present in each plot. Several studies have shown that competition variables and stand density have a remarkable influence on hcb values (Garber et al. 2008, Russell et al. 2014). Therefore, it is not surprising that the most repeated parameters in the models were dhratio and AGE.
Pan et al. (2020) observed that additional explanatory variables can significantly improve the prediction accuracy of an hcb model; however, introducing too many variables into a model can lead to overparameterization, which can produce a biased prediction (Fu et al. 2017) and increased forest inventory costs by requiring more measurements in the field (Pan et al. 2020). There are models with a high number of variables, e.g., six for C. betulus, but the Variance Inflation Factor (VIF) remains low.
Logistic models are considered by some authors to be those that provide the most accurate predictions for many tree species (Fu et al. 2017, Sharma et al. 2017). Rijal et al. (2012) observed that they significantly reduced bias and eliminated convergence problems.
In this study, the best accuracies were obtained for the U. laevis (21 used trees and R2=92.42%) and Tilia sp (139 used trees and R2=89.07%) models. On the other hand, the main species C. betulus (871 used trees and R2=67.55%) and Q. robur (1538 used trees and R2=80.57%) models had the lowest accuracies. These two species appeared in both the main and secondary vegetation layers, increasing the variability of hcb, which explains the low precision of their models. An alternative to reduce the variability of the hcb models would be to create models by species for each layer considered.
As expected, the correspondence between the field hcb and estimated hcb increased with outlier removal in all models in which outliers were detected. No outliers were found in A. campestre and U. laevismodels. In Tilia sp. models, only one outlier was found; two in A. glutinosa and F. angustifolia models; four for C. betulus; and 11 for Quercus robur. The larger the database, the larger the outliers found.
Our accuracies are moderately higher than those found in similar investigations. Rijal et al. (2012) evaluated the hcb in thirty species of the North American Acadian Region using a logistic equation with plot-level variables and competition variables, obtaining performances ranging from 47% to 79% of R2. Fu et al. (2017) studied the hcb of Mongolian oak natural forest located in the Northeast China. They obtained accuracies of 49.72% of R2 with logistic models using ht and dbh as the only independent variables. Sharma et al. (2017) applied logistic models to estimate the hcb for Picea abies and Fagus sylvatica in the Czech Republic, with 68% and 67% explained variances, respectively. They employed tree-level (ht), plot-level (Ho), and competition variables (the bal and basal area proportion of a species of interest) in their models.
Jia and Chen (2019) applied different methods to Larix olensis hcb modelling in Northeast China. Among them, the logistic model offered an accuracy of 73.04% R2 using plot-level variables. Pan et al. (2020) studied the hcb of L. olensis in Northeast China, and they obtained 70.63% of R2adj applying logistic models. As final variables, tree size measures and the spacing index were selected. Li et al. (2020) worked with Pinus massoniana in Southern China, obtaining an 88.03% R2adj by applying logistic equations in hcb modelling with ht and dbh as predictive variables.
Figure 2 represents the hcb residual distribution of fit plots against the predictions obtained. The distribution of the errors is homogeneous throughout all the predictions, thus, ruling out the presence of heteroscedasticity in the models.
![]() Figure 2. Residual vs. predicted hcb values for eight selected models.
Figure 2. Residual vs. predicted hcb values for eight selected models.
Validation results of the eight hcb models are shown in Table 5. After LOOCV, it can be seen how the values of the validation statistics increased slightly compared to those obtained in the fitting procedure, as in Fu et al. (2017), demonstrating the robustness of the models. None of them presented significant bias, and the RMSE ranged from 12.27% for A. glutinosa to 34.24% for C. betulus. The most abundant species (Q. robur) showed an error of 17.04%.ercentage; and p.BIASCV: BIAS p-value.
CONCLUSIONS
In this work, seven main species without previous hcb models were fitted. These proposed hcb models have high importance in their novelty, but foremost by their management implications. hcb is a tree structural measure and is, therefore, related to other structural variables. However, it is a characteristic strongly conditioned by the competence and social position of each tree. This makes it essential to consider the factors that describe the competition to which each tree is subjected. Therefore, the combination of tree and plot-level variables with the site index significantly contributed to the prediction accuracy of the proposed models. The distance-independent competition indexes explained the inter- and intraspecific critical relationships among trees to predict the hcb. These logistic models demonstrated their great versatility as they showed good precision in a wide range of species. The leave-one-out cross-validation further confirmed the high robustness of our logistic models.
Author Contributions
Conceptualization: RAP; methodology: RAP, SMG; processing: SMG; validation: SMG, RAP, IB; formal analysis: RAP, IB; investigation: SMG; resources and data curation: IB, LJ, IL; writing the original draft: SMG, IB, KI; review and editing the manuscript: RAP, IB; supervision: RAP; research funding: IB, IL. All authors have read and agreed to the published version of the manuscript.
Funding
This research was funded by the Department of Economy, Industry and Competitiveness, Spanish Government (DI-16-08446, Saray Martín-García), by the European Commission through the project "MySustainableForest" (H2020-EO-2017; 776045) and by the Croatian Science Foundation under the project IP-2016-06-7686 "Retrieval of Information from Different Optical 3D Remote Sensing Sources for use in Forest Inventory (3D-FORINVENT)". The work of doctoral student Luka Jurjević has been fully supported by the "Young researchers' career development project – training of doctoral students" of the Croatian Science Foundation funded by the European Union from the European Social Fund.
Acknowledgments
We would like to express our gratitude to the staff of the Croatian Forest Research Institute who helped in setting-up and measurements of sampling plots. Special thanks to Hrvatske vode, Zagreb, Croatia for providing LiDAR data.
Conflicts of Interest
The authors declare no conflict of interest.
Supplementary Materials
Suplementary File 1. Observed vs. predicted hcb values for 8 selected models. The diagonal line shows a 1:1 relationship.
REFERENCES
Balenović I, Jurjević L, Simic Milas A, Gašparović M, Ivanković D, Seletković A, 2019. Testing the Applicability of the Official Croatian DTM for Normalization of UAV-based DSMs and Plot-level Tree Height Estimations in Lowland Forests. Croat J For Eng 40(1): 163–174.
Cameron IR, Parish R, Goudie JW, Statland CAB, 2020. Modelling the crown profile of western hemlock (Tsuga heterophylla) with a combination of component and aggregate measures of crown size. Forests 11(3): 1–18. https://doi.org/10.3390/f11030281.
Cestar D, Kovačić Đ, 1981. Volume tables for deomestic and Euro-American poplars. Rad Šumar Inst Jastrebar 42: 1–176.
Cestar D, Kovačić Đ, 1982. Volume tables for black alder and black locust. Rad Šumar Inst Jastrebar 49: 1–149.
Cestar D, Kovačić Đ, 1984. Volume tables for narrow-leaved ash (Fraxinus parvifolia Auct.). Rad Šumar Inst Jastrebar 60: 1–178.
Chen J, Zhao CZ, Wang JW, Zhao LC, 2017. Canopy Structure and Radiation Interception of Salix matsudana: Stand Density Dependent Relationships. Chin J Plan Ecolo 41(6): 661–69. https://doi.org/10.17521/cjpe.2016.0257.
Croatian Forests Ltd, 2016. Forest Management Area Plan for the Republic of Croatia for the Period 2016–2025. Available online: https://poljoprivreda.gov.hr/istaknute-teme/sume-112/sumarstvo/sumskogospodarska-osnova-2016-2025/250 (15 June 2020).
Cruz MG, Alexander ME, Wakimoto RH, 2003. Assessing canopy fuel stratum characteristics in crown fire prone fuel types of western North America. Int J Wildland Fire 12(1): 39–50. https://doi.org/10.1071/WF02024.
Čater M, 2015. A 20-Year Overview of Quercus robur L. Mortality and Crown Conditions in Slovenia. Forests 6(3): 581–593. https://doi.org/10.3390/f6030581.
Dean TJ, Cao QV, Roberts SD, Evans DL, 2009. Measuring heights to crown base and crown median with LiDAR in a mature, even-aged loblolly pine stand. Forest Ecol Manag 257(1): 126–133. https://doi.org/10.1016/j.foreco.2008.08.024.
Drake JE, Tjoelker MG, Aspinwall MJ, Reich PB, Barton CVM, Medlyn BE, Duursma RA, 2016. Does physiological acclimation to climate warming stabilize the ratio of canopy respiration to photosynthesis? New Phytol 211(3): 850–863. https://doi.org/10.1111/nph.13978.
Fox J, Weisberg S, 2019. An {R} Companion to Applied Regression, Third Edition. Thousand Oaks CA: Sage. Available online: https://socialsciences.mcmaster.ca/jfox/Books/Companion/ (12 October 2019)
Fu L, Sun H, Sharma RP, Lei Y, Zhang H, Tang S, 2013. Nonlinear mixed-effects crown width models for individual trees of Chinese fir (Cunninghamia lanceolata) in south-central China. Forest Ecol Manag 302: 210–220. https://doi.org/10.1016/j.foreco.2013.03.036.
Fu L, Zhang H, Sharma RP, Pang L, Wang G, 2017. A generalized nonlinear mixed-effects height to crown base model for Mongolian oak in northeast China. Forest Ecol Manag 384: 34–43. https://doi.org/10.1016/j.foreco.2016.09.012.
Garber SM, Monserud RA, Maguire DA, 2008. Modeling crown recession in three conifer species of the northern Rocky Mountains. Forest Sci 54(6): 633–646.
Gupta SK, Ram J, Singh H, 2018. Comparative Study of Transpiration in Cooling Effect of Tree Species in the Atmosphere. Journal of Geoscience and Environment Protection 6(8): 151–66. https://doi.org/10.4236/gep.2018.68011.
Hasenauer H, Monserud RA, 1996. A crown ratio model for Austrian Forests. Forest Ecol Manag 84(1–3): 49–60. https://doi.org/10.1016/0378-1127(96)03768-1.
Hein S, Weiskittel AR, Kohnle U, 2008. Branch characteristics of widely spaced Douglas-fir in south-western Germany: Comparisons of modelling approaches and geographic regions. Forest Ecol Manag 256(5): 1064–1079. https://doi.org/10.1016/j.foreco.2008.06.009.
Jia W, Chen D, 2019. Nonlinear mixed-effects height to crown base and crown length dynamic models using the branch mortality technique for a Korean larch (Larix olgensis) plantations in northeast China. J Forestry Res 30(6): 2095–2109. https://doi.org/10.1007/s11676-019-01045-1.
Jiménez E, Vega JA, Fernández-Alonso JM, Vega-Nieva D, Álvarez-González JG, Ruiz-González AD, 2013. Allometric equations for estimating canopy fuel load and distribution of pole-size maritime pine trees in five Iberian provenances. Can J Forest Res 43: 149–158. https://doi.org/dx.doi.org/10.1139/cjfr-2012-0374.
Kershaw JA, Maguire DA, Harm DW, 1990. Longevity and duration of radial growth in Douglas-fir branches. Can J Forest Res 20: 169–1695. https://doi.org/10.1139/x90-225.
Klepac D, Fabijanić G, 1996. Management of Pedunculate oak forest. In: Klepac D (ed) Monography: Pedunculate Oak in Croatia. Croatian Academy of Science and Art and Croatian Forests Ltd., Zagreb, Croatia, pp. 257–272.
Köstner BMM, Schulze ED, Kelliher FM, Hollinger DY, Byers JN, Hunt JE, Weir PL, 1992. Transpiration and canopy conductance in a pristine broad-leaved forest of Nothofagus: An analysis of xylem sap flow and eddy correlation measurements. Oecologia 91: 350–359. https://doi.org/10.1007/BF00317623.
Li Y, Wang W, Zeng W, Wang J, Meng J, 2020. Development of crown ratio and height to crown base models for masson pine in Southern China. Forests 11(11): 1–17. https://doi.org/10.3390/f11111216.
Liu Q, Xie L, Li F, 2019. Dynamic Simulation of the Crown Net Photosynthetic Rate for Young Larix olgensis Henry Trees. Forests 10(4): 321. https://doi.org/10.3390/f10040321.
Luo L, Zhai Q, Su Y, Ma Q, Kelly M, Guo Q, 2018. Simple method for direct crown base height estimation of individual conifer trees using airborne LiDAR data. Opt Express 26(10): 767–781. https://doi.org/10.1364/OE.26.00A562.
Luo S, Chen JM, Wang C, Xi X, Zeng H, Peng D, Li D, 2016. Effects of LiDAR point density , sampling size and height threshold on estimation accuracy of crop biophysical parameters. Opt Express 24(11): 11578–11593. https://doi.org/10.1364/OE.24.011578.
Ma S, Osuna JL, Verfaillie J, Baldocchi DD, 2017. Photosynthetic responses to temperature across leaf–canopy–ecosystem scales: a 15-year study in a Californian oak-grass savanna. Photosynth Res 132(3): 277–291. https://doi.org/10.1007/s11120-017-0388-5.
Maguire DA, Kershaw JA, Hann DW, 1991. Predicting the effects of silvicultural regime on branch size and crown wood core in Douglas-fir. Forest Sci 37(5): 1409–1428. https://doi.org/10.1093/forestscience/37.5.1409.
Meinzer FC, Andrade JL, Goldstein G, Holbrook NM, Cavelier J, Wright SJ, 1999. Partitioning of soil water among canopy trees in a seasonally dry tropical forest. Oecologia 121(3): 293–301. https://doi.org/10.1007/s004420050931.
Michailoff I, 1943. Zahlenmässiges Verfahren für die Aus- führung der Bestandeshöhenkurven. Cbl und Thar Forstl Jahrbuch 6: 273–279.
Montgomery DC, 2009. Introduction To Statistical Quality Control. 6th edn. John Wiley & Sons Inc., 734 p.
Novotny V, Dekanić S, Božić M, Jazbec A, Dubravac T, Durbešić A, 2013. Current state and the structural analysis of the mixed even-aged pedunculate oak and common hornbeam forests in Croatia. Period Biol 115(3): 409-420.
Ostrogović Sever MZ, Alberti G, Delle Vedove G, Marjanović H, 2019. Temporal Evolution of Carbon Stocks, Fluxes and Carbon Balance in Pedunculate Oak Chronosequence under Close-To-Nature Forest Management. Forests 10(9): 814. https://doi.org/10.3390/f10090814.
Pan L, Mei G, Wang Y, Saeed S, Chen L, Cao Y, Sun Y, 2020. Generalized Nonlinear Mixed-Effect Model of Individual Tree Height to Crown Base for Larix olgensis Henry in Northeast China. J Sustain Forest 39(8): 827–840. https://doi.org/10.1080/10549811.2020.1734026.
Petritan AM, Von Lüpke B, Petritan IC, 2007. Effects of shade on growth and mortality of maple (Acer pseudoplatanus), ash (Fraxinus excelsior) and beech (Fagus sylvatica) saplings. Forestry 80(4): 397–412. https://doi.org/10.1093/forestry/cpm030.
Picard RR, Cook RD, 1984. Cross-validation of regression models. J Am Stat Assoc 79(387): 575–583. https://doi.org/10.2307/2288403.
Plain CD, Gerant D, Maillard P, Dannoura M, Dong Y, Zeller B, Priault P, Parent F, Epron D, 2009. Tracing of Recently Assimilated Carbon in Respiration at High Temporal Resolution in the Field with a Tuneable Diode Laser Absorption Spectrometer after in Situ 13CO2 Pulse Labelling of 20-Year-Old Beech Trees. Tree Physiol 29(11): 1433–1445. https://doi.org/10.1093/treephys/tpp072.
R Core Team, 2019. R: A language and environment for statistical computing. Vienna, Austria: R Foundation for Statistical Computing.
Rijal B, Weiskittel AR, Kershaw JA, 2012. Development of height to crown base models for thirteen tree species of the North American Acadian Region. Forest Chron 88(1): 60–73. https://doi.org/10.5558/tfc2012-011.
Ritchie MW, Hann DW, 1987. Equations for predicting height to crown base for fourteen tree species in southwest Oregon. Oregon State University, College of Forestry, Forest Research Laboratory, Corvallis, USA, Research Paper 50, 14 p. Avaialable online: http://cips.forestry.oregonstate.edu/sites/cips/files/FRL_RP50_SW7.pdf (15 June 2020).
Ruiz-González AD, Álvarez-González JG, 2011. Canopy bulk density and canopy base height equations for assessing crown fire hazard in Pinus radiata plantations. Can J Forest Res 41: 839–850. https://doi.org/10.1139/x10-237.
Russell MB, Weiskittel AR, 2011. Maximum and largest crown width equations for 15 tree species in Maine. North J Appl For 28(2): 84–91. https://doi.org/10.1093/njaf/28.2.84.
Russell MB, Weiskittel AR, Kershaw JA, 2014. Comparing strategies for modeling individual-tree height and height-to-crown base increment in mixed-species Acadian forests of northeastern North America. Eur J Forest Res 133(6): 1121–1135. https://doi.org/10.1007/s10342-014-0827-1.
Schumacher FX, Hall FDS, 1933. Logarithmic expression of timber-tree volume. J Agric Res 47: 719–734.
Scott JH, Reinhardt ED, 2001. Assessing Crown Fire Potential by Linking Models of Surface and Crown Fire Behavior. Fort Collins, CO: U.S: Department of Agriculture, USDA Forest Service, Rocky Mountain Research Station, USA, Research paperr (RMRS-RP-29), 59 p. https://doi.org/10.2737/RMRS-RP-29.
Sharma RP, Vacek Z, Vacek S, Podrázský V, Jansa V, 2017. Modelling individual tree height to crown base of Norway spruce (Picea abies (L.) Karst.) and European beech (Fagus sylvatica L.). PLoS ONE 12(10): 1–23. https://doi.org/10.1371/journal.pone.0186394.
Stenberg P, Kuuluvainen T, Kellomäki S, Grace JC, Jokela EJ, Gholz HL, 1994. Crown structure, light interception and productivity of pine trees and stands. Ecol Bull 43: 20–34.
Špiranec M, 1975. Volume tables for oak, beech, common hornbeam and European chestnut. Rad Šumar Inst Jastrebar 22: 1–262.
Thorpe H, Astrup R, Trowbridge A, Coates K, 2010. Competition and tree crowns: A neighborhood analysis of three boreal tree species. Forest Ecol Manag 259(8): 1586–1596. https://doi.org/10.1016/j.foreco.2010.01.035.
Valentine H, Ludlow A, Furnival G, 1994. Modeling crown rise in even-aged stands of Stika spruce or loblolly pine. Forest Ecol Manag 69(1–3): 189–197. https://doi.org/10.1016/0378-1127(94)90228-3.
Varma S, Simon R, 2006. Bias in error estimation when using cross-validation for model selection. BMC Bioinformatics 7: 1–8. https://doi.org/10.1186/1471-2105-7-91.
Walters DK, Hann DW, 1986. Taper equations for six conifer species in southwest Oregon. Oregon State University, College of Forestry, Forest Research Laboratory, Corvallis, USA, Research Bulletin 56, 41 p. Avaialable online: https://ir.library.oregonstate.edu/concern/technical_reports/pc289k323 (15 June 2020).
Zhang X, Luo L, Jing W, Wang S, Wang R, Che Z, 2007. Study on the Distribution Effect of Canopy Interception of Picea crassifolia Forest in Qilian Mountains. J Mt Sci 25: 678–683.
© 2021 by the Croatian Forest Research Institute. This is an Open Access paper distributed under the terms of the Creative Commons Attribution License (http://creativecommons.org/licenses/by/4.0).