
SEEFOR 11(2): 111-126
Article ID: 2013
DOI: https://doi.org/10.15177/seefor.20-13
ORIGINAL SCIENTIFIC PAPER
Diameter Structure Changes in the Pre-Maturing Black Locust and Common Hackberry Stand in the Subotica-Horgoš Sands under the Influence of a Late Thinning
Siniša Antun Andrašev1*, Martin Bobinac2, Tomislav Dubravac3, Nikola Šušić4
(1) University of Novi Sad, Institute of Lowland Forestry and Environment, Antona Čehova 13d, RS-21000 Novi Sad, Serbia;
(2) University of Belgrade, Faculty of Forestry, Kneza Višeslava 1, RS-11000 Belgrade, Serbia;
(3) Croatian Forest Research Institute, Division for Silviculture, Cvjetno naselje 41, HR-10450 Jastrebarsko, Croatia;
(4) University of Belgrade, Institute for Multidisciplinary Research, Kneza Višeslava 1, P.O. Box 33, RS-11030 Belgrade
Citation: Andrašev SA, Bobinac M, Dubravac T, Šušić N, 2020. Diameter Structure Changes in the Pre-Maturing Black Locust and Common Hackberry Stand in the Subotica-Horgoš Sands under the Influence of a Late Thinning. South-east Eur for 11(2): 111-126. https://doi.org/10.15177/seefor.20-13.
Received: 26 Jul 2020; Revised: 22 Sep 2020; Accepted: 23 Sep 2020; Published online: 28 Oct 2020
Cited by: Crossref Google Scholar
Abstract
In this paper, a change of diameter structure in a pre-maturing stand of black locust and common hackberry under the influence of a late thinning is analysed. The research is based on three permanent experimental plots and two measurements of diameters in a five-year period. One of the plots is a control plot and two plots are experimental, where the thinning was carried out in a stand 28-years old, with the thinning intensity of 28.9–30.6% of the initial density, approximately evenly distributed across diameter classes. In the investigated stand common hackberry came from the neighbouring areas in the stand structure. The initial measurement in the autumn of 2014 confirmed the share of common hackberry of 16–18% in the total number of trees thicker than 5 cm with a dominantly reversed J shape of the diameter structure and the presence of trees in all the diameter classes. In the period of stand age from 28 to 33 years, a dominant process on all treatments was the mortality of thinner trees, while the recruitment of common hackberry trees was recorded in all treatments. On the control plot, a quarter of the trees died, while an eighth of the remaining trees died in the thinned plots, mostly black locust trees. In thinned plots, only black locust trees died with a characteristic that the intensity of mortality was higher in thinner trees, while in the control plot some thick black locust trees died, as well as and some thinner common hackberry trees. In the five-year period, numerical parameters of variability (standard deviation, coefficient of variation), the shape of distributions (skewness and kurtosis) and heterogeneity of diameters at breast height (Gini index, Lorenz asymmetry coefficient) have shown a trend of increasing variability and change of diameter distributions of trees in all treatments, but it is more expressed in thinned plots compared to the control plots. Growth dominance coefficient of diameters shows that the competition between the collectives of both species and the black locust collective is of asymmetric type and more expressed in the thinning treatments. In common hackberry trees on the control plot the competition between the trees is of asymmetric type, while on the thinned plots, the competition is of symmetric type. This shows that after thinning, common hackberry has a biological potential that is higher than that of black locust and that the natural succession can be accelerated through thinnings.
Keywords: natural succession; tree mortality; numerical parameters of diameter structure; structure heterogeneity; asymmetric competition; symmetric competition
INTRODUCTION
Forest management influences tree size distributions, spatial mingling of tree species and natural regeneration. Forest structure affects a range of properties, including total biomass production, biodiversity and habitat functions, and thus the quality of ecosystem services. It usually refers to the way in which the attributes of trees are distributed within a forest ecosystem (von Gadow et al. 2012).
Biological populations have age, size, spatial and genetic structures. By knowing the dynamics of such structures, we can understand the functioning of populations. To understand plant communities in nature, we must also study the dynamic aspect of size structure (Hara 1988). The development of the trees in a pure stand or a species in a community can be characterized by their tree size distribution, growth distribution between trees, and mortality (Hara 1993). In single-cohort pure stands the diameter distribution is narrow and right skewed in the early stage, and becomes more and more symmetric, Gaussian-shaped with progressing stand development. Silvicultural treatment cuts mainly the left branch by thinning from below, the right branch by thinning from above, or simply reduces the level of the size distribution by systematic thinning, such as the elimination of every nth tree or tree row. Shade tolerant species tend towards wider size distributions than light-demanding species, as a lower light compensation point allows better persistence of small trees in deep shade (Pretzsch and Schütze 2014).
Size structure refers to the statistical distribution of a given individual plant size attribute in a population, for instance diameter, height or volume. It is generally characterized by the mean, the variance, the skewness and the kurtosis of the distribution (Hara 1988). The standard deviation can be used to compare differences in size variability between stands with the same mean tree size. The coefficient of variation is a normalized measure of variation and is useful for comparing stands with different mean tree sizes. The skewness coefficient estimates the degree of asymmetry in the frequency distribution of tree sizes. Skewness has been widely used to quantify changes in size variability with stand density and development. Kurtosis indicates the 'peakiness' of the distribution. Positive kurtosis indicates that a preponderance of trees congregated in the same or nearby size classes to form a peak in the size-frequency distribution which increases as the value of kurtosis increases. Negative kurtosis indicates flattened distributions with individual trees more evenly distributed among the size classes (Bi and Turvey 1996, McGown et al. 2016). The kurtosis is appropriate for characterizing the degree of restriction of a species by intra- and inter-specific competition (Pretzsch and Schütze 2014).
Weiner and Solbrig (1984) formally defined size hierarchy as a frequency distribution where the variation in individual sizes is large, the majority of individuals are small, and a few large individuals contribute most of the population’s biomass. With this definition, Weiner and Solbrig (1984) argued that standard summary statistics, specifically the skewness coefficient, were unable to describe the most important aspects of size hierarchy effectively. This represented a shift in the discussion of quantifying size variability from a focus on describing the frequency distribution of individual plant sizes to describing the concentration of sizes within a stand (size inequality). Weiner and Solbrig (1984) used the Gini coefficient, a summary statistic from the Lorenz curve, to measure the total inequality, or concentration of sizes, within a population. Damgaard and Weiner (2000) introduced an additional parameter, the Lorenz asymmetry coefficient, which provides information about the shape of the Lorenz curve and describes how size inequality is distributed within a stand.
Plant size describes the cumulative growth of an individual. Managers may be more interested in how growth is currently distributed within a stand and less concerned with past growth. This requires moving away from measures of size variation and inequality. Previous studies have utilized distribution-modifying functions to relate changes in size distributions over time to the growth of individuals (e.g., Westoby 1982, Hara 1984). Binkley (2004) introduced the concept of growth dominance to estimate where growth is concentrated within a stand. Growth dominance of an individual is estimated by its proportion of total stand growth to its proportion of stand volume and is not a measure of size variation or size inequality. If the proportion of growth is greater than its proportion of stand volume, the individual is said to be "growth dominant" regardless of its size or crown position (McGown et al. 2016).
The aim of this paper is to perceive the change in diameter structure in a stand of black locust and common hackberry in which thinnings were applied over a period of five years using standard procedures to describe diameter structure, numerical indicators of descriptive statistics, heterogeneity and growth dominance pattern.
MATERIALS AND METHODS
Study Area
The research was conducted in a black locust and common hackberry stand in Management Unit (MU) "Subotičke šume", which represents a majority of the Subotica-Horgoš sands consisting entirely of anthropogenic stands. Subotica-Horgoš sands are located in the northern part of Bačka loess plateau. The city of Subotica is surrounded by the sands from the northern side, up to the border with Hungary.
The sands originated in the early Pleistocene (Diluvial), in the period of glaciations, when rivers brought sand and mud from the Alps and Carpathians during the summer. In the winter, when the rivers returned to their beds, the winds carried the material and deposited it in the form of sand or loess in the area of present-day sands and loess terraces. In this way, different forms of sands were created: greyish-yellow sand, brown sand, black sand, black loamy sand and salified sand. On the soils formed mostly on black sands and in the valleys, natural forests of pedunculate oak, white poplar and black poplar were present. Other parts of the sands were covered by grass vegetation (pastures) or consisted of moving sands that caused wind erosion in a wide area with negative effects for agriculture and settlements (Pavićević and Stankević 1962, Šijak 1980).
The work on the stabilization of moving sands using the rapid-growing tree species such as willows, poplars, limes, black locust and tree-of-heaven started at the end of 18th century. The initial establishment of the stands was carried out more or less successfully because of the inadequate selection of tree species and establishment techniques. The turning point was 1870 when black locust was used after deep tillage mostly on greyish-yellow sand where other tree species could not survive. After World War I, the advantage was given to Austrian pine in the afforestation of the sands (Peruničić 1956).
According to the available literature, there is no data about planned introduction of common hackberry in the area of Subotica-Horgoš sands. Common hackberry (Celtis occidentalis L.) is a non-native tree species that was introduced to Europe in 1636 and presumably in the first half of the 19th century in the area of the Pannonian Basin (Hungary), primarily as a park tree species for settlements. At the beginning of the 20th century, common hackberry was used widely for afforestation in present-day Hungary (Bartha and Csiszar 2008). Having in mind that the area of Subotica-Horgoš sands belonged to Hungary (Austro-Hungarian Empire) at the beginning of the 20th century, it can be presumed that common hackberry was used for afforestation in the sands as well, given that the species was quite drought-tolerant (Tiborcz et al. 2011). Outside Subotica-Horgoš sands, common hackberry was mostly cultivated in Serbia as a park tree species and in tree alleys. On the other hand, black locust (Robinia pseudoacacia L.) was widely used in Serbia and is considered to be an important tree species for forestry, having in mind its wide use (Banković et al. 2009; Andrašev et al. 2014).
In 1969, black locust was the most represented tree species in MU "Subotičke šume" in the area of Subotica-Horgoš sands and covered the area of 2,450 ha out of 3,500 ha of forests and forest cultures. Other tree species included poplars (470 ha), Austrian pine (around 500 ha), pedunculate and Turkey oak (42 ha) and other broadleaves on 140 ha (Šijak 1980).
The inventory of the stands in 2009 showed that black locust covers 1,750 ha, where pure black locust stands cover almost 600 ha, and the rest are mixed stands. Having in mind the limits of stand delineation and stand measurements, primarily in young, coppice black locust stands that were in the inventory in 1999 in MU "Subotičke šume" and were classified as pure black locust stands in the area of 2,100 ha, it is evident that the data from 2009 show a trend of tree species succession, especially when it comes to common hackberry. The analysis of the 20-year period from the inventory data from 1999 and 2019 for MU "Subotičke šume" (1999, 2009, 2019) showed a trend of a quadruple increase in total area with common hackberry (Table 1). In 1999, common hackberry was recorded on over 500 ha and on 1,277 ha in 2009. The stands with common hackberry domination in terms of the number of trees covered the area of 101 ha in 1999 and 271 ha in 2009, while pure stands of common hackberry (90% of common hackberry in the total number of trees) covered the area of 15 ha in 1999 and 29 ha in 2009. The trend of a two-fold increase in the total area covered by common hackberry was recorded in the inventory from 2019 as well (Table 1).
Field Operations and Measurement
In the autumn of 2014 in a 28-year-old stand of black locust and common hackberry, three permanent sample plots were established. The size of the plots is 25 × 25 m with a buffer zone 5–10 m wide (MU "Subotičke šume", compartment 59). Black locust originates mostly from coppice shoots and common hackberry mostly from seed. The investigated stand has a special purpose and a primary function of soil protection because it is situated on a site that is prone to erosion. So far, cleaning was carried out at an age between 5 to 10 years. On two of the permanent plots, the late thinning was carried out (treatments T1 and T2) and one of the plots was the control plot (treatment C). When the plots were established, two cross diameters with an accuracy of 1 mm were measured for all trees and the initial results were published (Andrašev et al. 2016). In the autumn of 2019, the trees were measured again where the diameter threshold was 5 cm at breast height with an accuracy of 1 mm. This threshold was used for both measurements so they could be compared. The diameter comparison of trees over 5 cm at breast height when the plots were established and five years later showed the number of trees (level of recruitment) that grew above the 5 cm threshold. Two stand conditions were observed: (1) initial stand condition in autumn of 2014 and (2) stand condition in autumn of 2019. Since two tree species were recorded in the stand, black locust and common hackberry, the trees were grouped in three collectives: (a) trees of both species; (b) black locust trees and (c) common hackberry trees.
Data Processing and Statistical Analysis
Data processing included the expression of diameter structures in trees per hectare by grouping the diameters at breast height (DBHs) in 2 cm wide diameter classes. The comparison of diameter structures of trees from different treatments (C, T1 and T2) in different conditions was performed using the non-parametric tests by Kolmogorov-Smirnov, Anderson-Darling and Wilcox (Dodge 2008).
For all stand conditions and all collectives of trees in the stand, the basic parameters of descriptive statistics and indexes of heterogeneity (inequality) that express the numerical parameters of diameter structures were calculated: arithmetic mean, standard deviation, coefficient of variation, skewness, kurtosis, Gini index of heterogeneity and Lorenz asymmetry coefficient as an addition to the Gini index. The parameters of descriptive statistics were calculated using the well-known formulas from the theory of statistics (Field et al. 2012). The Lorenz curve was calculated by ranking individual diameters from the smallest to the largest and plotted cumulative fraction of diameters against cumulative fraction of the population. If all individuals have equal diameters the Lorenz curve will be a diagonal line from the origin (0% of the population contains 0% of the diameter sum) to the upper right corner (100% of the population contains 100% of the diameter sum). Any inequality results in a curve below the diagonal. The Gini index is a summary statistic from the Lorenz curve expressing the proportion of the area between the Lorenz curve and the diagonal line and the area of the triangle defined by the diagonal line (1/2). It has a minimum of 0 and a theoretical maximum of 1. The Gini index was widely used in econometrics, expressing inequality of income between individuals in population, and is calculated using the formula (Sean, 1973):
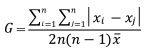
where: xi, xj - diameter at brest height of i and j tree in the sample, n - number of trees in the sample, - arithmetic mean of diameters.
The Gini index, as a summary statistic, is not able to cover the specificity of the Lorenz curve, so the Lorenz asymmetry coefficient was introduced as a statistic that shows which of the diameter classes contributes more to the total heterogeneity expressed through the Gini index. It was shown that the collectives may have the same Gini index of heterogeneity but may differ in terms of the share of certain size classes that have a more pronounced contribution to the heterogeneity of the whole collective (Damgaard and Weiner 2000). The Lorenz asymmetry coefficient was calculated using the method presented in Damgaard and Weiner (2000).
The diameter increment was calculated as the difference between DBH of each tree which was alive and greater than 5 cm in both measurements divided by five years. The initial DBHs of trees that produced the increment were used for calculation of the growth dominance coefficient — GDC (Binkley 2004). GDC is not a size variation measure, but instead it is a summary statistic that indicates how growth is distributed among individuals within a stand (Binkley 2004). For size ordered data, the cumulative proportion of tree size (x-axis) is plotted against the cumulative proportion of tree growth (y-axis). Bounded between –1 and 1, positive GDC values indicate that larger trees have a proportion of stand increment that is greater than their proportion of cumulative stand size, negative GDC values indicate that smaller trees account for a greater proportion of stand increment than cumulative stand size, and a value of zero indicates that all trees contribute to stand growth proportionally to their size (i.e. no dominance). GDC was calculated using methods described in West (2014), with diameter as a measure of tree size.
Since the previously mentioned numerical indicators of diameter structure are a summary statistic calculated based on at least 30 trees, bootstrap resampling was performed in order to make an objective comparison of their confidence intervals, which has been confirmed for the Gini coefficient by Weiner (1985) and Dixon et al. (1987). The confidence intervals were calculated at the 95% level of significance using the bootstrap resampling technique (Efron and Tibshirani 1986), so a more objective comparison was achieved. The bootstrap resampling method is a method for generating a sample using the original sample with the same number of observations, but some are removed, while some occur more than once (a new sample with repetitions is generated). This procedure is repeated for a certain number of times (at least 200) and results in a confidence interval for every of the investigated indicators of the structure (Efron and Tibshirani 1993). In this paper, every sample is repeated 1000 times. The confidence interval that was calculated from the original sample statistics and standard deviation of the means was generated from repeated samples using the bootstrap resampling method, according to the formula:

where xu,l — upper (u) and lower (l) confidence interval at the level of significance of 95%; x — statistics of original sample (arithmetic mean, standard deviation, coefficient of variation, skewness, kurtosis, Gini coefficient, Lorenz asymmetry coefficient, growth dominance coefficient); se — standard deviation of the means of every statistic generated using the bootstrap resampling.
To examine the probability of death (p) in relation to the size of individual trees (DBH), each tree was assigned a score of 0 if it was dead in 2019 and a score of 1 otherwise. Logistic regression (Kleinbaum and Klein 2010) was then used to relate the binary response to diameters as independent variable:

and
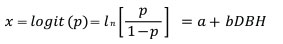
where DBH is diameter at breast height and a and b are parameters.
All statistical analysis was done using R version 4.0.0 (R Core Team 2020) and all figures were prepared with ggplot2 package in R environment (Wickham 2016).
RESULTS
Initial Stand Condition
The stand condition at the age of 28 years shows that the total number of trees with DBH higher than 5 cm was 3.152–4.080 per hectare, and the share of common hackberry was 16–18% (Figure 1, Table 2). Non-parametric tests by Kolmogorov-Smirnov and Anderson-Darling did not confirm significant differences between the diameter distributions of black locust and common hackberry collectives, as well as the collective with both species between the treatments (Tables 3 and 4). The statistical test that compares the medians of DBHs according to the method by Wilcox did not determine significant differences between the treatments in the initial stand conditions on the sample plots, except in the case of black locust collective between C and T1 treatments (Table 5). Arithmetic mean of diameters of both species collective and black locust collective was 9.1–9.8 cm and was inversely proportional to the total number of trees per hectare, while the mean diameter of common hackberry was 9.3–11.1 cm and was not related to the total number of trees per hectare. The mean diameters of common hackberry trees were lower by 0.1 cm compared to black locust trees on T1 plot, higher by 0.2 cm compared to black locust on the control plot and higher by 2.0 cm on T2 plot (Table 2). The confidence intervals calculated using the bootstrap resampling did not show any significant differences between the treatments in any of the collectives (Figure 2).
![]() Figure 1.Total number of trees per hectare.
Figure 1.Total number of trees per hectare.
The share of thinner trees is dominant in all the collectives in the stand. Diameter distribution of trees above the 5 cm diameter threshold has a reverse J shape in all the collectives in C and T1 treatments and in the common hackberry collective in T2 treatment. Only in black locust collective and both species collective in T2 treatment, a clear unimodal diameter distribution was observed (Figure 3). Standard deviation and coefficient of variation of diameters in all treatments are similar in the both species collective, but higher in common hackberry trees compared to that of black locust. The confidence intervals calculated using the bootstrap resampling show that a significant difference exists only between the black locust collective and common hackberry collective in T2 treatment (Figure 4).
![]() Figure 3. Diameter distributions of trees per hectare grouped into 2 cm wide diameter classes.
Figure 3. Diameter distributions of trees per hectare grouped into 2 cm wide diameter classes.
Skewness is significantly higher than zero in all treatments and tree collectives, so a pronounced right asymmetry of diameter structures was observed. In the T2 treatment, skewness is less pronounced, especially in common hackberry collective, but the confidence intervals do not show significant differences. Kurtosis in both species collective is positive and shows that DBH values cluster around the arithmetic mean. In T1 and C treatments, kurtosis is higher compared to T2 treatment, which is even more pronounced in common hackberry collective, although the confidence intervals do not show any significant differences (Figure 5).
Heterogeneity of diameter of trees expressed in a summarized way using the Gini index differs only slightly between all treatments and collectives. In black locust collective, heterogeneity of DBHs is lower compared to the common hackberry collective, and a significant difference can be observed in the T2 treatment between the black locust collective and common hackberry collective. The Lorenz asymmetry coefficient, as an addition to the Gini heterogeneity coefficient, is close to 1 in both species collective and black locust collective. However, in common hackberry collective in T2 treatment, the Lorenz asymmetry coefficient is lower than 1, compared to the other two treatments where it is higher than 1. This shows that thicker trees in T2 treatment contribute more to the Gini index of heterogeneity compared to thinner trees (Figure 6).
Tree Mortality and Thinning
Through thinning, 912 trees in T1 treatment and 1,072 trees in T2 treatment, or 28.9% and 30.6% respectively were excluded, compared to the total number of trees above 5 cm diameter threshold. The share of black locust (94.0–94.7%, Table 2) is dominant in the thinning yield. In both treatments, the DBHs of excluded trees were 5–20 cm. In treatment T1, the excluded trees’ DBHs spanned from 5.1 to 19.2 cm and in treatment T2 from 5.75 to 20.8 cm (Figure 7). Arithmetic mean diameter of marked trees for cutting of both species collective was 10.3 cm in T1 treatment and 9.9 cm in T2 treatment. The logistic curve model of dependency between probability of the tree exclusion by thinning and DBHs show an almost linear trend with zero slope in both thinning treatments (Figure 8, left). This shows that the thinning excluded the tree diameters proportionately to their share in the diameter structure before thinning. This was confirmed by the statistical test as well (Table 6).
Mortality was recorded in all treatments in the five-year period. The highest mortality was recorded in C treatment where 922 trees per hectare or 24.3% (both species) died. Mortality was recorded in treatments T1 and T2 as well, but at a much lesser extent than in C treatment. In T1 treatment, 400 trees died, and in T2 treatment 448 trees per hectare or 12.7–12.8%. In C treatment, the mortality of black locust trees was dominant with 960 dead trees per hectare and 32 dead common hackberry trees per hectare. In treatments T1 and T2, mortality of only black locust trees was recorded. Naturally, thinner trees are dying. The diameter intervals of dead trees were 5.0–12.8 cm with a mean diameter of 7.3 cm in C treatment, 5.0–9.5 cm with a mean diameter of 6.2 cm in T1 treatment and 5.0–6.7 cm with a mean diameter of 6.2 cm in T2 treatment. The diameter distribution of dead trees has a reverse J shape (Figure 7) that is successfully modelled using the logistic curve of dependency between probability of the death and DBHs (Figure 8). In all the treatments the statistical test shows that there is a significant dependency between probability of mortality and DBHs (p < 0.001). The shape of the mortality curve differs between the C treatment and T1 and T2 treatments at the risk level of p = 0.052–0.045 (Table 6). Due to performed thinnings and tree mortality in treatments T1 and T2, a total of 1,312–1,520 trees (both species combined) were excluded (41.6–43.4%). In treatment C, 992 trees per hectare or 24.3% were excluded from the total number of trees above the 5 cm diameter threshold in the period of experiment establishment (Table 2). Diameter distribution of excluded trees from the stand has a reverse J shape (Figure 7), and the logistic curve model has confirmed the significant impact of tree diameter on the tree exclusion probability from the stand (Table 6, Figure 8). The shape of the excluded trees’ curve differs between the C treatment and T1 and T2 at the risk level of p < 0.001 (Table 6).
Stand Condition after Five Years
After five years, the number of trees in the treatments has increased by 32–80 trees or 1.7–2.6% due to the recruitment of trees that grew above the diameter threshold of 5 cm. All the recruited trees are common hackberry trees in all of the treatments. When their number is expressed relatively compared to the number of common hackberry trees, the intensity of recruitment is 6.2–12.9%. Due to the recruitment, the share of common hackberry trees is 24.7–29.1% of the total number of trees (Table 2). Non-parametric tests by Kolmogorov-Smirnov, Anderson-Darling and Wilcox did not confirm the significant differences between investigated treatments, except in the case of common hackberry between C and T2 treatments (Tables 3–5). The diameter distributions of black locust collective and both species collective show a clear unimodal shape with a modal diameter class of 6–8 cm. On the contrary, the distribution of common hackberry collective does not show a clear unimodal distribution (Figure 3).
The arithmetic mean diameters of black locust and common hackberry trees have shown a trend of increase over a five-year period in all treatments. Yet, the common hackberry collective shows an even more pronounced trend of increase in T1 and T2 treatments than that of C treatment and more pronounced than that of black locust. The confidence intervals calculated using the bootstrap resampling method did not show significant differences between the treatments after the thinning in the five-year period, which is the same result as from the pre-thinning condition (Figure 2).
Standard deviation and coefficient of variation of DBHs have shown an increasing trend in the five-year period in all collectives and treatments. However, differences exist between the collectives of black locust and common hackberry in terms of the level of increase and total values of standard deviation. While the black locust collective is characterized by lower values of standard deviation and coefficient of variation, the common hackberry collective’s absolute (standard deviation) and relative (coefficient of variation) variability has higher values. In T1 and T2 treatments, the increase of standard deviation in the five-year period is higher than the increase of coefficient of variability. In both species collective, the increase of standard deviation and coefficient of variation is similar in all treatments. The confidence intervals do not confirm the significant differences between the treatments inside certain collectives. Only the black locust collective is significantly different from the common hackberry collective in the T2 treatment in terms of standard deviation and coefficient of variation of diameters in the five-year period after the thinning (Figure 4).
Skewness and kurtosis values have not changed in any of the collectives or treatments in the five-year period after thinning in the investigated stand. The confidence intervals do not confirm the significant differences between treatments in investigated tree collectives (Figure 5).
The heterogeneity of tree diameters in the five-year period, expressed as the Gini coefficient, has had an increasing trend compared to the pre-thinning condition. The increasing trend is less expressed in black locust collective than in the common hackberry collective. Confidence intervals do not show significant differences between treatments inside respective collectives, and differences can be seen between the black locust collective and common hackberry collective in the T2 treatment. The Lorenz asymmetry coefficient has had a stagnating trend during the five-year period after the thinning and the confidence intervals are wide and do not show any significant differences between treatments and tree collectives (Figure 6).
Diameter Increment of Trees
Diameter increment expressed relative to initial values of DBHs, better known as the growth dominance pattern, differs between the treatments in the both species collective. While 60% of trees produce 75% of highest diameter increments in C treatment, 40% of trees produce the same percentage of diameter increments in T2 treatment. Growth dominance coefficient (GDC) expresses the point estimate of diameter increment heterogeneity. In the C treatment for both species collective, GDC is 0.26 and in T2 treatment 0.41, so the heterogeneity of diameter increments is higher in T2 treatments. Confidence intervals at the level of significance of 95% indicate differences between the GDC in treatments C and T2 (Figure 9).
Black locust trees have a similar GDC ratio between thinning treatments, but the heterogeneity of diameter increments is less expressed. Confidence intervals do not confirm the significant differences in terms of GDC between treatments. In common hackberry trees, GDC is higher in C treatment compared to T1 and T2 and higher compared to that of black locust trees. Still, GDC of common hackberry trees in T1 and T2 treatments is close to 0, showing how homogenous the diameter increments are in relation to the initial DBHs of trees. Confidence intervals are wide and do not show any significant differences between treatments (Figure 9).
DISCUSSION AND CONCLUSION
Black locust is a dominant exotic tree species in the area of Subotica-Horgoš sands that was used for afforestation in stabilizing the sands. Common hackberry, which is an exotic tree species too, was in the past, as well as in the present, a tree species that is mostly planted in tree alleys and parks in towns in Vojvodina and used, to a much lesser extent, for afforestation of the sands, as compared to black locust (Bartha and Csiszár 2008).
During the last decades, an expansion of common hackberry has been confirmed in Subotica-Horgoš sands — an increase in the total area covered by common hackberry was confirmed, and an increase in the area where the species is dominant (Table 1).
In the investigated stand, which was initially formed as a black locust stand after clearcutting, as a normal silvicultural measure in regenerating black locust stands a spontaneous expansion of common hackberry from the neighbouring stands was recorded. The share of common hackberry trees is not even across the area of the investigated stand. The trees in the dominant layer are mostly represented in the part of the stand close to the border with the stand that contains mature common hackberry trees. On the other side of the investigated stands, common hackberry trees are only individually represented in the sub-canopy (Figure 10 and 11). In the initial measurements in autumn of 2014 at stand age of 28 years, all trees taller than 1.3 m were measured. A total of 5.000–6.380 trees per hectare were counted with a share of common hackberry trees of 1.660–2.160 trees per hectare (28.7–38.0%). Common hackberry trees were represented in all diameter and height classes, but the highest ratio was in the thinnest diameter class of 2.5 cm (Andrašev et al. 2016).
![]() Figure 10. Part of the stand where common hackberry trees enter the dominant layer.
Figure 10. Part of the stand where common hackberry trees enter the dominant layer.
Tree mortality has been a dominant process related to DBHs of trees in thinned plots (treatments T1 and T2) in autumn of 2014 and of control plot (C plot) in the stand age of 28–33 years. Due to the mortality in C treatment, a quarter of trees died (992 trees per hectare), mostly thinnest black locust trees. Besides the performed thinnings that reduced the number of trees by 30% (912–1,072 trees per hectare) uniformly across diameter classes, after the thinning one eighth of the trees of the total number of trees before the thinning (400–448 trees per hectare) died in the five-year period. In thinned plots only black locust trees died and mortality was higher in trees with smaller diameters compared to the control plot where some thicker trees died as well.
A recruitment of 32–64 common hackberry trees above the 5 cm diameter threshold was confirmed during the measurements performed at stand age of 33 years. Together with mortality and thinning of black locust, the recruitment contributes to a relative increase of the number of common hackberry trees from 16–18% to 24.7–29.1%.
Both species collective and black locust collective have a similar tendency in terms of structural change due to mortality and thinnings, which can be explained by the total share of black locust of over 70% in the total number of trees. Arithmetic mean diameter of both species collective and black locust collective is inversely proportional to the total number of trees in both measurements. On the control plot, arithmetic mean diameter of both species collective is higher by 0.6 cm in the five-year period and in the thinned plots by 1.0 cm, which can be attributed to the more pronounced reaction to thinning, which has been confirmed by many previous studies (Medhurst et al. 2001, Mäkinen and Isomäki 2004, Río et al. 2017).
As a consequence of growth in the five-year period, there has been a trend of increasing variability and change of distribution shape in all treatments which is more expressed in thinned plots. The Gini heterogeneity coefficient shows a trend of slight increase. Such changes were reported by Hara (1988), Knox et al. (1989), Bi and Turvey (1996), McGown et al. (2016), Soares et al. (2016).
Growth dominance pattern (GDP) of diameter incre-ments may point to the so-called "asymmetric" competition for light which is directly related to the use of the growing space. If GDP is concave and far from the homogeneity line (straight line with the slope coefficient of 45 degree), the asymmetric competition is more expressed between the trees. Growth dominance coefficient (GDC) is a point estimate of GDP and shows that GDC on control treatment is significantly lower than on T2 treatment. In black locust collective, GDP is similar to the collective of both species, but with less expressed values. This shows that the black locust trees have an asymmetric competition for growing space, or that the initially thicker trees compared to the thin trees released from competition show an increased reaction (higher diameter increment). The greatest level of growth dominance was found by Bradford et al. (2010) in a thinned stand with the greatest level of variation in tree size, which is in accordance with our results.
Common hackberry collective changed only slightly in terms of numerical parameters of diameter structure, having in mind that the thinning excluded a small number of trees and mortality was not recorded on thinned plots. The mean diameter of common hackberry has increased by 1.7–2.0 cm on thinned plots and by 0.7 on the control plot, because of growth in the five-year period. In this period, the parameters of diameter structure variability of common hackberry collective are clearly increasing unlike the parameters of shape of the distribution and heterogeneity of tree diameters that do not show a clear trend.
The current state of investigated stands shows a similar share of common hackberry trees in the total number of trees, but the numerical parameters of structure differ. This points to a different share of diameter classes of common hackberry on the plots. On the T2 plot, the mean diameter of common hackberry is higher by 1.4–1.8 cm compared to the mean diameter of common hackberry on other two plots and by 2.0 cm higher compared to the black locust collective on T2 plot. After five years, the mean diameter of common hackberry on T2 treatment is higher than that of black locust by 2.7 cm, unlike the T1 plot where it is higher by only 0.4 cm. Such differences are a consequence of initially different mean diameters of black locust in T1 treatment compared to the T2 treatment.
Growth dominance pattern of common hackberry collective show differences compared to the other two collectives. On the control plot, GDP has a convex shape, and GDC is 0.25, which is somewhat less than in both species collective on the control plot. This shows that diameter increments are heterogeneous and higher in thicker trees compared to thin ones and that an asymmetric competition of common hackberry occurs in the stand. However, GDP of common hackberry trees on the experimental plots T1 and T2 is close to the line of homogeneity of diameter increments and is lower than zero on T2 plot. This shows that the diameter increments of common hackberry are similar and do not depend on their DBHs.
Therefore, the competition for light or growing space in common hackberry on thinned plots (T1 and T2) is of so-called "symmetric" type.
This is a biological characteristic of common hackberry and represents a potential for controlled and fast natural conversion with black locust in the performed silvicultural procedure in the stands in this area, or the procedure that speeds up the natural succession of the species using thinnings.
Author Contributions
SA and MB conceived and designed the research, SA carried out the field measurements, SA and NŠ processed the data and performed the statistical analysis, SA, MB and TD wrote the manuscript.
Funding
This study was financed by the Ministry of Education, Science and Technological Development of the Republic of Serbia (Project No: 451-03-68/2020-14/200197, 451-02-68/2020-14/200169 and 451-03-68/2020-14/200053).
Conflicts of Interest
The authors declare no conflict of interest.
REFERENCES
Andrašev S, Rončević S, Ivanišević P, Pekeč S, Bobinac M, 2014. Productivity of black locust (Robinia pseudoacacia L.) stands on chernozem in Vojvodina. Bulletin of the Faculty of Forestry 110: 9-32. https://doi.org/10.2298/GSF1410009A. .
Andrašev S, Bobinac M, Redei K, 2016. Contribution to knowledge of structure of mixed black locust and common hackberry stands in the area of Subotica-Horgos sands (Serbia). In: Kovačević D (ed.) Book of Proceedings of VII International Scientific Agriculture Symposium “Agrosym 2016”, Jahorina, 6 – 9 October 2016. Faculty of Agriculture, East Sarajevo, Bosnia and Hercegovina, pp 2862-2867. https://doi.org/10.7251/AGRENG1607431.
Banković S, Medarević M, Pantić D, Petrović N, 2009. The national forest inventory of the Republic of Serbia – The growing stock of the Republic of Serbia. Ministry of Agriculture, Forestry and Water Management of the Republic of Serbia – Forest Directorate, Belgrade, Serbia.
Bartha D, Csiszár Á, 2008. Common hackberry (Celtis occidentalis L.). In: Botta-Dukát Z, Balogh L (eds) The most invasive plants in Hungary. Institute of Ecology ang Botany, Hungarian Academy of Sciences, Vácrátót, Hungary, pp 95-102.
Bi H, Turvey ND, 1996. Competition in Mixed Stands of Pinus radiata and Eucalyptus obliqua. J Appl Ecol 33(1): 87-99. https://doi.org/10.2307/2405018.
Binkley D, 2004. A hypothesis about the interaction of tree dominance and stand production through stand development. Forest Ecol Manag 190: 265-271. https://doi.org/10.1016/j.foreco.2003.10.018.
Bradford JB, D’Amato AW, Palik BJ, Fraver S, 2010. A new method for evaluating forest thinning: growth dominance in managed Pinus resinosa stands. Can J For Res 40(5): 843-849. https://doi.org/10.1139/X10-039.
Damgaard C, Weiner J, 2000. Describing inequality in plant size or fecundity. Ecology 81(4): 1139-1142. https://doi.org/10.1890/0012-9658(2000)081[1139:DIIPSO]2.0.CO;2.
Dixon PM, Weiner J, Mitchell-Olds T, Woodley R, 1987. Bootstrapping the gini coefficient of inequality. Ecology 68(5): 1548-1551. https://doi.org/10.2307/1939238.
Dodge Y, 2008. The Concise Encyclopedia of Statistics. Springer-Verlag, New York, USA. https://doi.org/10.1007/978-0-387-32833-1.
Efron B, Tibshirani R, 1986. Bootstrap methods for standard errors, confidence intervals, and other measures of statistical accuracy. Stat Sci 1(1): 54–77.
Efron B, Tibshirani R, 1993. An Introduction to the Bootstrap. Chapman & Hall, New York, USA.
Field AP, Miles J, Field Z, 2012. Discovering statistics using R. SAGE Publications Ltd, London, UK.
von Gadow K, Zhang CY, Wehenkel C, Pommerening A, Corral-Rivas J, Korol M, Myklush S, Hui GY, Kiviste A, Zhao XH, 2012. Forest Structure and Diversity. In: Pukkala T, von Gadow K (eds) Continuous Cover Forestry. Managing Forest Ecosystems, vol 23. Springer, Dordrecht, The Netherlands, pp 29-83. https://doi.org/10.1007/978-94-007-2202-6_2.
Hara T, 1984. Dynamics of stand structure in plant monocultures. J Theor Biol 110(2): 223-239. https://doi.org/10.1016/S0022-5193(84)80055-7.
Hara T, 1988. Dynamics of size structure in plant populations. Trends Ecol Evol 3(6): 129-133. https://doi.org/10.1016/0169-5347(88)90175-9.
Hara T, 1993. Mode of competition and size-structure dynamics in plant communities. Plant Spec Biol 8(2-3): 75-84. https://doi.org/10.1111/j.1442-1984.1993.tb00059.x.
Kleinbaum DG, Klein M, 2010. Logistic Regression - A Self‐Learning Text, Third Edition. Springer-Verlag New York, USA. https://doi.org/10.1007/978-1-4419-1742-3.
Knox RG, Peet RK, Christensen NL, 1989. Population dynamics in loblolly pinestands: changes in skewness and size inequality. Ecology 70(4): 1153-1166. https://doi.org/10.2307/1941383.
Mäkinen H, Isomäki A, 2004. Thinning intensity and long-term changes in increment and stem form of Norway spruce trees. Forest Ecol Manag 201(2-3): 295-309. https://doi.org/10.1016/j.foreco.2004.07.017.
McGown KI, O’Hara K, Youngblood A, 2016. Patterns of size variation over time in ponderosa pine stands established at different initial densities. Can J For Res 46(1): 101-113. https://doi.org/10.1139/cjfr-2015-0096.
Medhurst JL, Beadle CL, Neilsen WA, 2001. Early-age and later-age thinning affects growth, dominance, and intraspecific competition in Eucalyptus nitens plantations. Can J For Res 31(2): 187-197. https://doi.org/10.1139/x00-163.
Раvićevic N, Stаnkеvić Р, 1962. Pedological characteristics of the Subotica-Horgos sands. Institute of wooden industry of Serbia, Special edition 17, Belgrade, Serbia. (in Serbian).
Peruničić B, 1956. Forests in the surrounding of Subotica, their origin and development. Forestry (Belgrade) 9(1-2): 86-88. (in Serbian).
Pretzsch H, Schütze G, 2014. Size-structure dynamics of mixed versus pure forest stands. Forest Syst 23(3): 560-572. https://doi.org/10.5424/fs/2014233-06112.
Río MD, Bravo-Oviedo A, Pretzsch H, Löf M, Ruiz-Peinado R, 2017. A review of thinning effects on Scots pine stands: From growth and yield to new challenges under global change. Forest Syst 26(2): 02. http://dx.doi.org/10.5424/fs/2017262-11325.
R Core Team, 2020. R: A language and environment for statistical computing. R Foundation for Statistical Computing, Vienna, Austria. URL https://www.R-project.org/.
Sean A, 1973. On econometric inequality. Clarendon, Oxford. England. https://doi.org/10.1093/0198281935.001.0001.
Šijak M, 1980. Contribution to the knowledge dendroflora of Subotica-Horgos sands. Forestry (Belgrade) 33(3): 39-46. (in Serbian).
Soares AAV, Leite HG, Souza AL, Silva SR, Louren co HM, Forrester DI, 2016. Increasing stand structural heterogeneity reduces productivity in Brazilian Eucalyptus monoclonal stands. Forest Ecol Manag 373: 26-32. https://doi.org/10.1016/j.foreco.2016.04.035.
Tiborcz V, Zagyvai G, Korda M, Schmidt D, Csiszár Á, Šporčić D, Teleki B, Bartha D, 2011. Distribution and significance of some invasive alien woody plant species in Hungary. Available from: https://www.google.rs/url?sa=t&rct=j&q=&esrc=s&source=web&cd=1&cad=rja&uact=8&ved=0CCEQFjAA&url=http%3A%2F%2Fwww.wsl.ch%2Fepub%2Fewrs%2Fsessions%2Fdownload%3Fp%3D1160%2F6-217-final-278_Tiborcz_Distribution_of_invasive_correction.pdf%26o%3D278_Tiborcz_Distribution_of_invasive_correction.pdf%26sid%3D13195606191161433218288459086&ei=V5rkVMXmN8jOygPDrIKoAw&usg=AFQjCNFyVkAprkP7DGML1Ym6yDpGan5gig&bvm=bv.85970519,d.bGQ.
Weiner J, Solbrig OT, 1984. The meaning and measurement of size hierarchies in plant populations. Oecologia 61: 334-336. https://doi.org/10.1007/BF00379630.
Weiner J, 1985. Size hierarchies in experimental populations of annual plants. Ecology 66(3): 743-752. https://doi.org/10.2307/1940535.
West PW, 2014. Calculation of a growth dominance statistic for forest stands. Forest Sci 60(6): 1021-1023. https://doi.org/10.5849/forsci.13-186.
Westoby M, 1982. Frequency distributions of plant size during competitive growth of stands: the operation of distribution-modifying functions. Ann Bot 50: 733-735.
Wickham H, 2016. ggplot2: Elegant Graphics for Data Analysis, Second Edition. Springer-Verlag New York, USA. https://doi.org/10.1007/978-3-319-24277-4.
***1999. Forest management plan for the management unit “Subotičke šume” for period of 2000-2009. Public Company “Srbijašume”, Forest Holding Sombor. [in Serbian]
***2009. Forest management plan for the management unit “Subotičke šume” for period of 2010-2019. Public Company “Vojvodinašume”, Forest Holding Sombor. [in Serbian].
***2019. Forest management plan for the management unit “Subotičke šume” for period of 2020-2029. Public Company “Vojvodinašume”, Forest Holding Sombor. [in Serbian].
© 2020 by the Croatian Forest Research Institute. This is an Open Access paper distributed under the terms of the Creative Commons Attribution License (http://creativecommons.org/licenses/by/4.0).